LARIS on human tonsil Slide-tags data, inference and visualization#
Import LARIS#
[1]:
path = '/data1/mdai/Analysis/Jupyter/Python/Package/LARIS'
import sys
sys.path.append(path)
import laris as la
Import other packages#
[2]:
import numpy as np
import pandas as pd
import scanpy as sc
import matplotlib.pyplot as plt
import warnings
warnings.simplefilter(action='ignore', category=FutureWarning)
[3]:
sc.set_figure_params(dpi=96,dpi_save=300, color_map='viridis',facecolor='white')
plt.rcParams['figure.figsize'] = 4, 4
sc.settings.verbosity = 3
sc.logging.print_header()
scanpy==1.9.6 anndata==0.10.3 umap==0.5.5 numpy==1.26.2 scipy==1.11.4 pandas==2.1.3 scikit-learn==1.3.2 statsmodels==0.14.0 igraph==0.11.3 louvain==0.8.1 pynndescent==0.5.11
[4]:
# Colours
from matplotlib import cm
from matplotlib import colors, colorbar
cmap_own = cm.get_cmap('magma_r', 256)
newcolors = cmap_own(np.linspace(0,0.75 , 256))
Greys = cm.get_cmap('Greys_r', 256)
#newcolors[:1, :] = Greys(np.linspace(0.8125, 0.8725, 1))
newcolors[:10, :] = Greys(np.linspace(0.8125, 0.8725, 10))
pos_cmap = colors.ListedColormap(newcolors)
/tmp/ipykernel_3278614/2129373808.py:4: MatplotlibDeprecationWarning: The get_cmap function was deprecated in Matplotlib 3.7 and will be removed two minor releases later. Use ``matplotlib.colormaps[name]`` or ``matplotlib.colormaps.get_cmap(obj)`` instead.
  cmap_own = cm.get_cmap('magma_r', 256)
/tmp/ipykernel_3278614/2129373808.py:6: MatplotlibDeprecationWarning: The get_cmap function was deprecated in Matplotlib 3.7 and will be removed two minor releases later. Use ``matplotlib.colormaps[name]`` or ``matplotlib.colormaps.get_cmap(obj)`` instead.
  Greys = cm.get_cmap('Greys_r', 256)
Load data#
mkdir -p /data1/mdai/Result/single-cell/Methods/LARIS/tutorial
cd /data1/mdai/Result/single-cell/Methods/LARIS/tutorial
gdrive files download 170cY6MjzUlOyaHlHq-N8_vqgKKPwQ_8N
[5]:
adata=sc.read('/data1/mdai/Result/single-cell/Methods/LARIS/tutorial/adata_tonsil.h5ad') # Read in the anndata object
[6]:
adata
[6]:
AnnData object with n_obs × n_vars = 5695 × 25583
    obs: 'n_genes_by_counts', 'log1p_n_genes_by_counts', 'total_counts', 'log1p_total_counts', 'pct_counts_in_top_50_genes', 'pct_counts_in_top_100_genes', 'pct_counts_in_top_200_genes', 'pct_counts_in_top_500_genes', 'total_counts_mt', 'log1p_total_counts_mt', 'pct_counts_mt', 'total_counts_ribo', 'log1p_total_counts_ribo', 'pct_counts_ribo', 'n_genes', 'cell_type', 'region_name'
    var: 'gene_ids', 'feature_types', 'genome', 'mt', 'ribo', 'n_cells_by_counts', 'mean_counts', 'log1p_mean_counts', 'pct_dropout_by_counts', 'total_counts', 'log1p_total_counts', 'n_cells', 'highly_variable', 'means', 'dispersions', 'dispersions_norm', 'var_across_cell_types'
    uns: 'cell_type_colors', 'hvg', 'log1p', 'neighbors', 'pca', 'region_name_colors', 'umap'
    obsm: 'X_pca', 'X_spatial', 'X_umap'
    varm: 'PCs'
    layers: 'CellBender_raw_X'
    obsp: 'connectivities', 'distances'
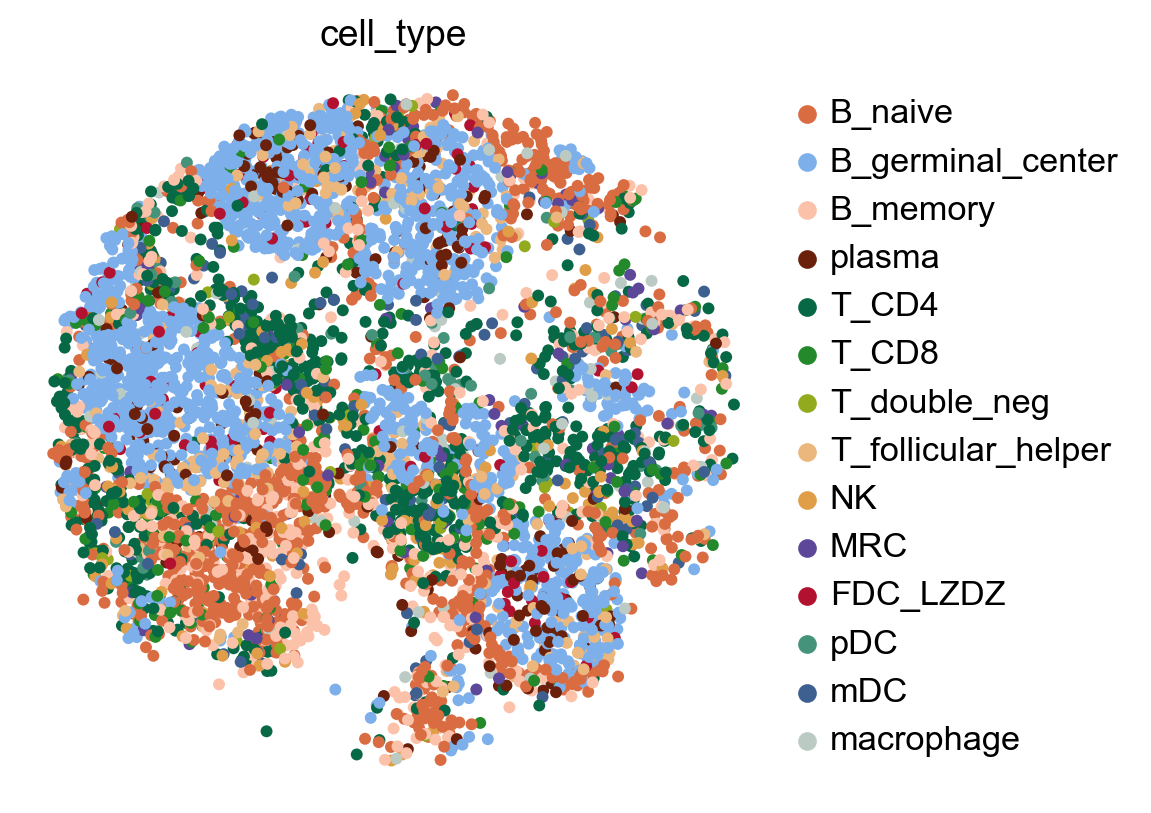
[7]:
# Check spatial mapping
x_width=adata.obsm['X_spatial'][:,0].max()-adata.obsm['X_spatial'][:,0].min()
y_width=adata.obsm['X_spatial'][:,1].max()-adata.obsm['X_spatial'][:,1].min()

plt.rcParams['figure.figsize'] = 5, 5*y_width/x_width

sc.pl.embedding(
    adata,
    basis='X_spatial',
    color=['cell_type'],
    size=80,frameon=False)

plt.rcParams['figure.figsize'] = 4, 4
/data1/mdai/.conda/envs/scda/lib/python3.9/site-packages/scanpy/plotting/_tools/scatterplots.py:394: UserWarning: No data for colormapping provided via 'c'. Parameters 'cmap' will be ignored
  cax = scatter(
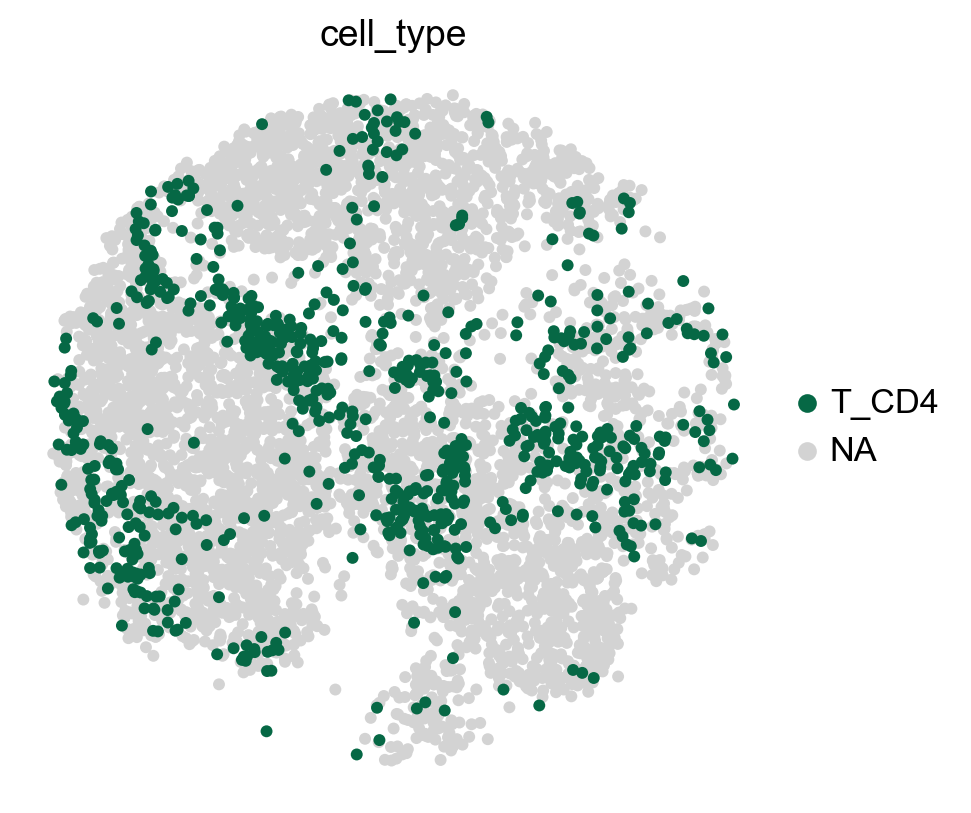
[8]:
# Check spatial mapping
x_width=adata.obsm['X_spatial'][:,0].max()-adata.obsm['X_spatial'][:,0].min()
y_width=adata.obsm['X_spatial'][:,1].max()-adata.obsm['X_spatial'][:,1].min()

plt.rcParams['figure.figsize'] = 5, 5*y_width/x_width

sc.pl.embedding(
    adata,
    basis='X_spatial',
    color=['cell_type'],
    groups=['T_CD4'],
    size=80,frameon=False)

plt.rcParams['figure.figsize'] = 4, 4
/data1/mdai/.conda/envs/scda/lib/python3.9/site-packages/scanpy/plotting/_tools/scatterplots.py:394: UserWarning: No data for colormapping provided via 'c'. Parameters 'cmap' will be ignored
  cax = scatter(
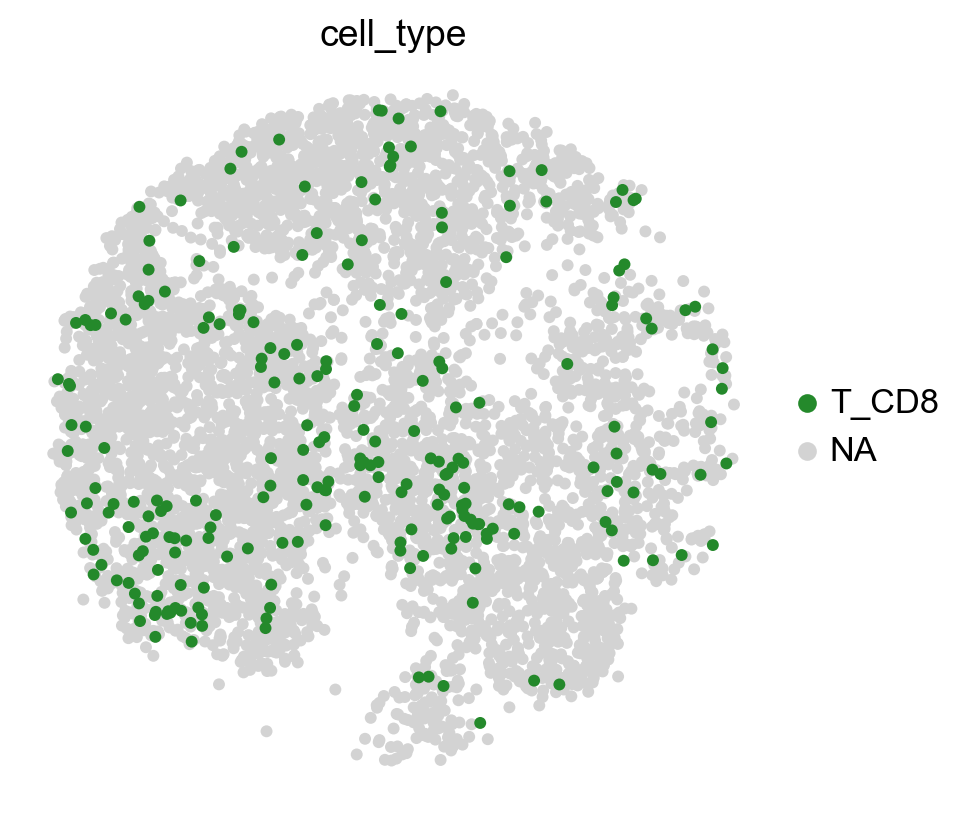
[9]:
# Check spatial mapping
x_width=adata.obsm['X_spatial'][:,0].max()-adata.obsm['X_spatial'][:,0].min()
y_width=adata.obsm['X_spatial'][:,1].max()-adata.obsm['X_spatial'][:,1].min()

plt.rcParams['figure.figsize'] = 5, 5*y_width/x_width

sc.pl.embedding(
    adata,
    basis='X_spatial',
    color=['cell_type'],
    groups=['T_CD8'],
    size=80,frameon=False)

plt.rcParams['figure.figsize'] = 4, 4
/data1/mdai/.conda/envs/scda/lib/python3.9/site-packages/scanpy/plotting/_tools/scatterplots.py:394: UserWarning: No data for colormapping provided via 'c'. Parameters 'cmap' will be ignored
  cax = scatter(
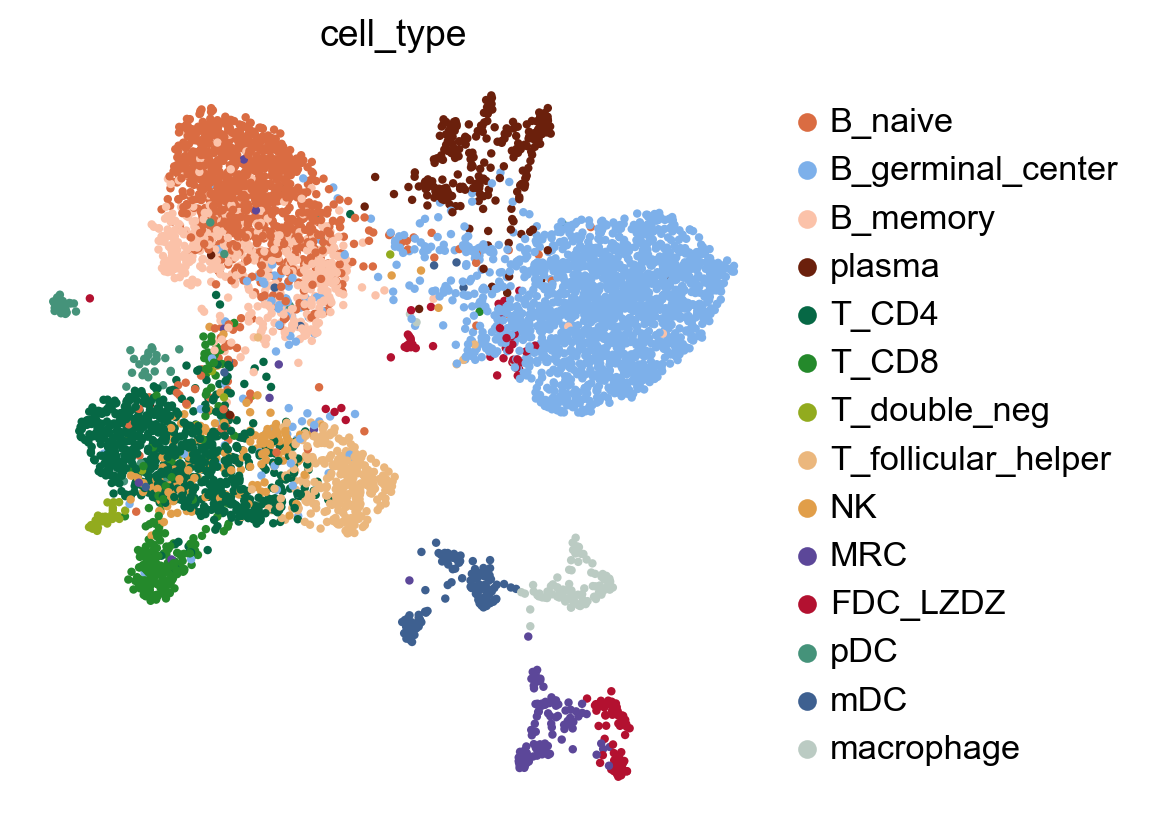
[10]:
# Check spatial UMAP
x_width=adata.obsm['X_umap'][:,0].max()-adata.obsm['X_umap'][:,0].min()
y_width=adata.obsm['X_umap'][:,1].max()-adata.obsm['X_umap'][:,1].min()

plt.rcParams['figure.figsize'] = 5, 5*y_width/x_width

sc.pl.embedding(
    adata,
    basis='X_umap',
    color=['cell_type'],
    size=40,frameon=False)

plt.rcParams['figure.figsize'] = 4, 4
/data1/mdai/.conda/envs/scda/lib/python3.9/site-packages/scanpy/plotting/_tools/scatterplots.py:394: UserWarning: No data for colormapping provided via 'c'. Parameters 'cmap' will be ignored
  cax = scatter(
Run LARIS#
Load the cell-cell interaction database#
[11]:
%%time
# Any dataframe could be used as long as 'ligand' and 'receptor' coloumns exist
lr_df=pd.read_csv('/data1/mdai/Result/single-cell/Methods/LARIS/tutorial/human_lr_database_CellChatDB_formatted_v2.csv',index_col=0)
CPU times: user 55 ms, sys: 3.55 ms, total: 58.5 ms
Wall time: 57.4 ms
[12]:
lr_df.head()
[12]:
| pathway_name | ligand | receptor | agonist | antagonist | co_A_receptor | co_I_receptor | evidence | annotation | interaction_name_2 | ... | receptor.symbol | receptor.family | receptor.location | receptor.keyword | receptor.surfaceome_main | receptor.surfaceome_sub | receptor.adhesome | receptor.secreted_type | receptor.transmembrane | version | |
|---|---|---|---|---|---|---|---|---|---|---|---|---|---|---|---|---|---|---|---|---|---|
| interaction_name | |||||||||||||||||||||
| TGFB1_TGFBR1_TGFBR2 | TGFb | TGFB1 | TGFBR2 | TGFb agonist | TGFb antagonist | NaN | TGFb inhibition receptor | KEGG: hsa04350 | Secreted Signaling | TGFB1 - (TGFBR1+TGFBR2) | ... | TGFBR2, TGFBR1 | Protein kinase superfamily, TKL Ser/Thr protei... | Cell membrane, Secreted, Membrane raft, Cell s... | Membrane, Secreted, Disulfide bond, Kinase, Tr... | Receptors | Act.TGFB;Kinase | NaN | NaN | True | CellChatDB v1 |
| TGFB1_TGFBR1_TGFBR2 | TGFb | TGFB1 | TGFBR1 | TGFb agonist | TGFb antagonist | NaN | TGFb inhibition receptor | KEGG: hsa04350 | Secreted Signaling | TGFB1 - (TGFBR1+TGFBR2) | ... | TGFBR2, TGFBR1 | Protein kinase superfamily, TKL Ser/Thr protei... | Cell membrane, Secreted, Membrane raft, Cell s... | Membrane, Secreted, Disulfide bond, Kinase, Tr... | Receptors | Act.TGFB;Kinase | NaN | NaN | True | CellChatDB v1 |
| TGFB2_TGFBR1_TGFBR2 | TGFb | TGFB2 | TGFBR2 | TGFb agonist | TGFb antagonist | NaN | TGFb inhibition receptor | KEGG: hsa04350 | Secreted Signaling | TGFB2 - (TGFBR1+TGFBR2) | ... | TGFBR2, TGFBR1 | Protein kinase superfamily, TKL Ser/Thr protei... | Cell membrane, Secreted, Membrane raft, Cell s... | Membrane, Secreted, Disulfide bond, Kinase, Tr... | Receptors | Act.TGFB;Kinase | NaN | NaN | True | CellChatDB v1 |
| TGFB2_TGFBR1_TGFBR2 | TGFb | TGFB2 | TGFBR1 | TGFb agonist | TGFb antagonist | NaN | TGFb inhibition receptor | KEGG: hsa04350 | Secreted Signaling | TGFB2 - (TGFBR1+TGFBR2) | ... | TGFBR2, TGFBR1 | Protein kinase superfamily, TKL Ser/Thr protei... | Cell membrane, Secreted, Membrane raft, Cell s... | Membrane, Secreted, Disulfide bond, Kinase, Tr... | Receptors | Act.TGFB;Kinase | NaN | NaN | True | CellChatDB v1 |
| TGFB3_TGFBR1_TGFBR2 | TGFb | TGFB3 | TGFBR2 | TGFb agonist | TGFb antagonist | NaN | TGFb inhibition receptor | KEGG: hsa04350 | Secreted Signaling | TGFB3 - (TGFBR1+TGFBR2) | ... | TGFBR2, TGFBR1 | Protein kinase superfamily, TKL Ser/Thr protei... | Cell membrane, Secreted, Membrane raft, Cell s... | Membrane, Secreted, Disulfide bond, Kinase, Tr... | Receptors | Act.TGFB;Kinase | NaN | NaN | True | CellChatDB v1 |
5 rows × 27 columns
Remove ligand and receptors not present in the object#
[13]:
rows_keep=np.logical_and( lr_df['ligand'].isin(adata.var_names), lr_df['receptor'].isin(adata.var_names) )
[14]:
lr_df=lr_df.loc[rows_keep].copy()
Create the ligand-receptor anndata object#
[15]:
%%time
lr_adata=la.tl.prepareLRInteraction(
    adata, # object used to construt the LR object
    lr_df, # dataframe to use for interactions
    number_nearest_neighbors=20,
    use_rep_spatial='X_spatial'
)
CPU times: user 2.41 s, sys: 168 ms, total: 2.58 s
Wall time: 2.58 s
Run LARIS#
To:
identify spatially variable and specific ligand-receptor interactions
infer the interation directionality at cell type level if
by_celltypeset toTrue
[16]:
%%time
import warnings
warnings.filterwarnings("ignore")
LARIS_variable_interactions, res_LARIS=la.tl.runLARIS(
    lr_adata,
    adata,
    use_rep='X_spatial',
    n_nearest_neighbors=20,
    random_seed=27,
    n_repeats=5,
    mu = 0.40, # larger value indicates more consideration for specificity
    sigma=100,
    remove_lowly_expressed=False,
    expressed_pct=0.1,
    n_cells_expressed_threshold=100,
    n_top_lr=lr_adata.shape[1],

    by_celltype=True,
    ### Parameters for cell type-level inference when by_celltype set to True
    groupby='cell_type', # label to group by
    use_rep_spatial='X_spatial', # spatial coordinates
    mu_celltype=100, # higher value puts more emphasis on cell type specificity
    expressed_pct_celltype=0.1, # expression percentage cut off per cell type
    remove_lowly_expressed_celltype=False,
    mask_threshold=1e-6, # mask for cosg, lower value is less restrictive
    n_neighbors_permutation=30,
    score_threshold= 1e-10,
    spatial_weight = 3.0,
)
======================================================================
LARIS ANALYSIS
======================================================================

Input data: 5695 cells × 1985 LR pairs
Mode: Cell type-specific analysis

--- Step 1: Calculating spatial specificity scores ---
  - Using 20 nearest neighbors
  - Regularization parameter μ = 0.4
  - Random repeats: 5
  - Generating random permutations...
  ✓ Identified 1985 top spatially-specific LR pairs
  - Score range: [-0.0431, 0.6720]

======================================================================
CELL TYPE-SPECIFIC ANALYSIS
======================================================================

Analyzing 14 cell types from 'cell_type'
Cell types: ['B_germinal_center', 'B_memory', 'B_naive', 'FDC_LZDZ', 'MRC', 'NK', 'T_CD4', 'T_CD8', 'T_double_neg', 'T_follicular_helper']...

======================================================================
LARIS CELL TYPE ANALYSIS
======================================================================

--- Step 1: Calculating ligand and receptor cell type specificity ---
  ✓ Computed specificity for 962 genes across 14 cell types

--- Step 2: Calculating diffused LR-score distribution ---
  ✓ Computed diffused scores for 1985 interactions

--- Step 3: Computing interaction scores (spatial_weight=3.0) ---
  ✓ Processed 1985 interactions

--- Step 3.5: Rescaling interaction scores ---
  - Scaling factor: 0.770511 (based on top 100 scores)

--- Step 4: Incorporating spatial cell type co-localization ---
  ✓ Calculated co-localization for 1985 interactions and 196 sender-receiver pairs
  ✓ Applied co-localization weights

--- Step 4.5: Cleaning up numerical precision (threshold=1e-10) ---
  - Before: 339,668 scores < threshold, 261,703 exactly zero
  - After: 339,668 scores set to exactly 0.0

======================================================================
STATISTICAL SIGNIFICANCE TESTING
======================================================================

--- Step 5.1: Preparing background interaction sets ---
  - Calculating summary statistics for 1985 interactions...
  - Building KDTree to find 30 nearest neighbors...
  - Background set prepared: 1985 interactions

--- Step 5.2: Calculating p-values (1,000 permutations) ---
  - Method: Standard
  - Chunk size: 50,000
  - Testing 196 sender-receiver pairs
  ✓ Calculated p-values for 389,060 interaction combinations

--- Step 5.3: Applying FDR correction (Benjamini-Hochberg) ---
  - Strategy: Pre-filtered
  - Pre-filter threshold: 0.0
  ✓ Corrected 196 sender-receiver pairs
  - Interactions tested: 49,392
  - Interactions filtered: 339,668

  Significant interactions:
  - FDR < 0.05: 4,498 (1.16%)
  - FDR < 0.01: 1,700 (0.44%)

======================================================================
STATISTICAL TESTING COMPLETE
======================================================================

======================================================================
LARIS CELL TYPE ANALYSIS COMPLETE
======================================================================

Final results: 389,060 sender-receiver-LR combinations
Score range: [0.000000, 0.900057]

======================================================================
ANALYSIS COMPLETE
======================================================================

Results summary:
  - Spatially-specific LR pairs: 1985
  - Cell type combinations: 389,060
  - Significant interactions (FDR < 0.05): 4,498
CPU times: user 2min 20s, sys: 268 ms, total: 2min 20s
Wall time: 2min 20s
Check the spatial variable LR interaction#
[17]:
LARIS_variable_interactions.shape
[17]:
(1985, 4)
[18]:
res_LARIS.shape
[18]:
(389060, 9)
[19]:
LARIS_variable_interactions.head(10)
[19]:
| ligand | receptor | score | Rank | |
|---|---|---|---|---|
| SEMA4A::PLXNA4 | SEMA4A | PLXNA4 | 0.671992 | 0 |
| LAMB1::CD44 | LAMB1 | CD44 | 0.670729 | 1 |
| FCER2::CR2 | FCER2 | CR2 | 0.658593 | 2 |
| APP::CD74 | APP | CD74 | 0.658068 | 3 |
| PTPRC::MRC1 | PTPRC | MRC1 | 0.654901 | 4 |
| PTPRC::CD22 | PTPRC | CD22 | 0.641263 | 5 |
| LAMB3::CD44 | LAMB3 | CD44 | 0.638657 | 6 |
| SEMA4D::PLXNB1 | SEMA4D | PLXNB1 | 0.635213 | 7 |
| COL4A1::CD44 | COL4A1 | CD44 | 0.634731 | 8 |
| IL4::IL4R | IL4 | IL4R | 0.633580 | 9 |
[20]:
res_LARIS.head()
[20]:
| sender | receiver | interaction_score | ligand | receptor | interaction_name | p_value | p_value_fdr | nlog10_p_value_fdr | |
|---|---|---|---|---|---|---|---|---|---|
| 0 | B_naive | B_naive | 0.900057 | FCER2 | CR2 | FCER2::CR2 | 0.000999 | 0.010570 | 1.975922 |
| 1 | B_memory | B_memory | 0.538235 | COL4A3 | CD44 | COL4A3::CD44 | 0.000999 | 0.012469 | 1.904168 |
| 2 | B_germinal_center | B_germinal_center | 0.397066 | SEMA4A | PLXNB2 | SEMA4A::PLXNB2 | 0.000999 | 0.014026 | 1.853067 |
| 3 | T_double_neg | NK | 0.344916 | CLEC2D | KLRB1 | CLEC2D::KLRB1 | 0.000999 | 0.009419 | 2.025989 |
| 4 | B_memory | B_naive | 0.337151 | COL4A3 | CD44 | COL4A3::CD44 | 0.000999 | 0.012947 | 1.887830 |
[21]:
pd.Series(res_LARIS['p_value']<0.05).value_counts()
[21]:
p_value
False    380288
True       8772
Name: count, dtype: int64
[22]:
pd.Series(res_LARIS['p_value_fdr']<0.05).value_counts()
[22]:
p_value_fdr
False    384562
True       4498
Name: count, dtype: int64
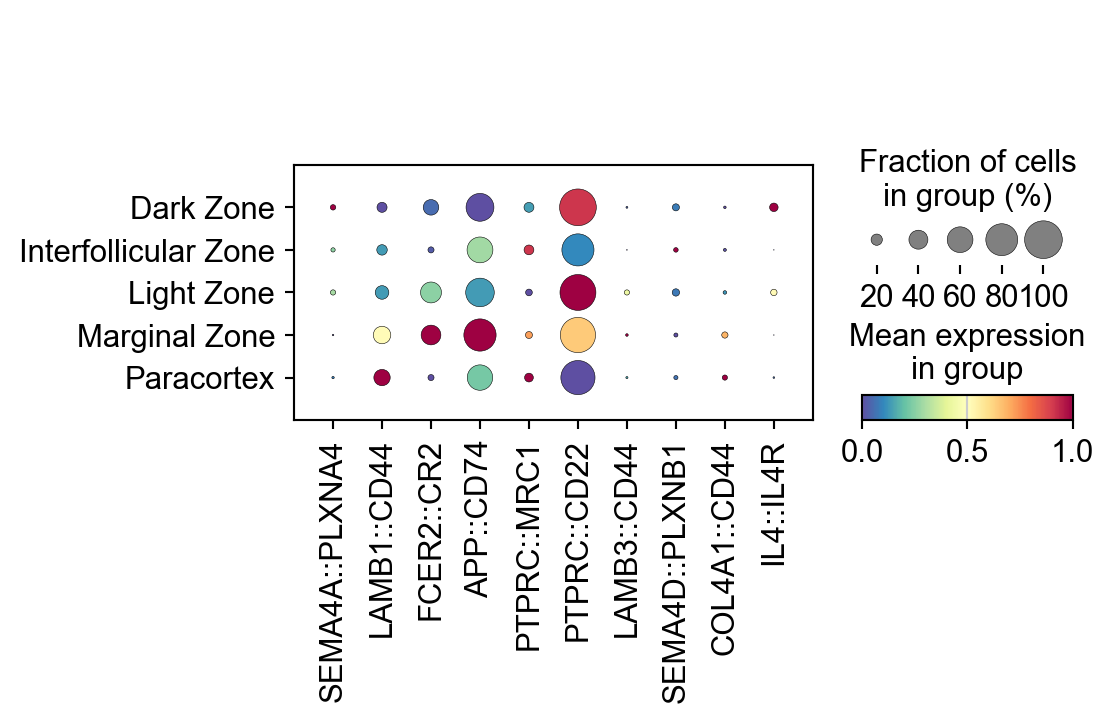
[23]:
sc.pl.dotplot(lr_adata,
              LARIS_variable_interactions.index[:10],
              groupby='region_name',
             standard_scale='var',
             cmap='Spectral_r')
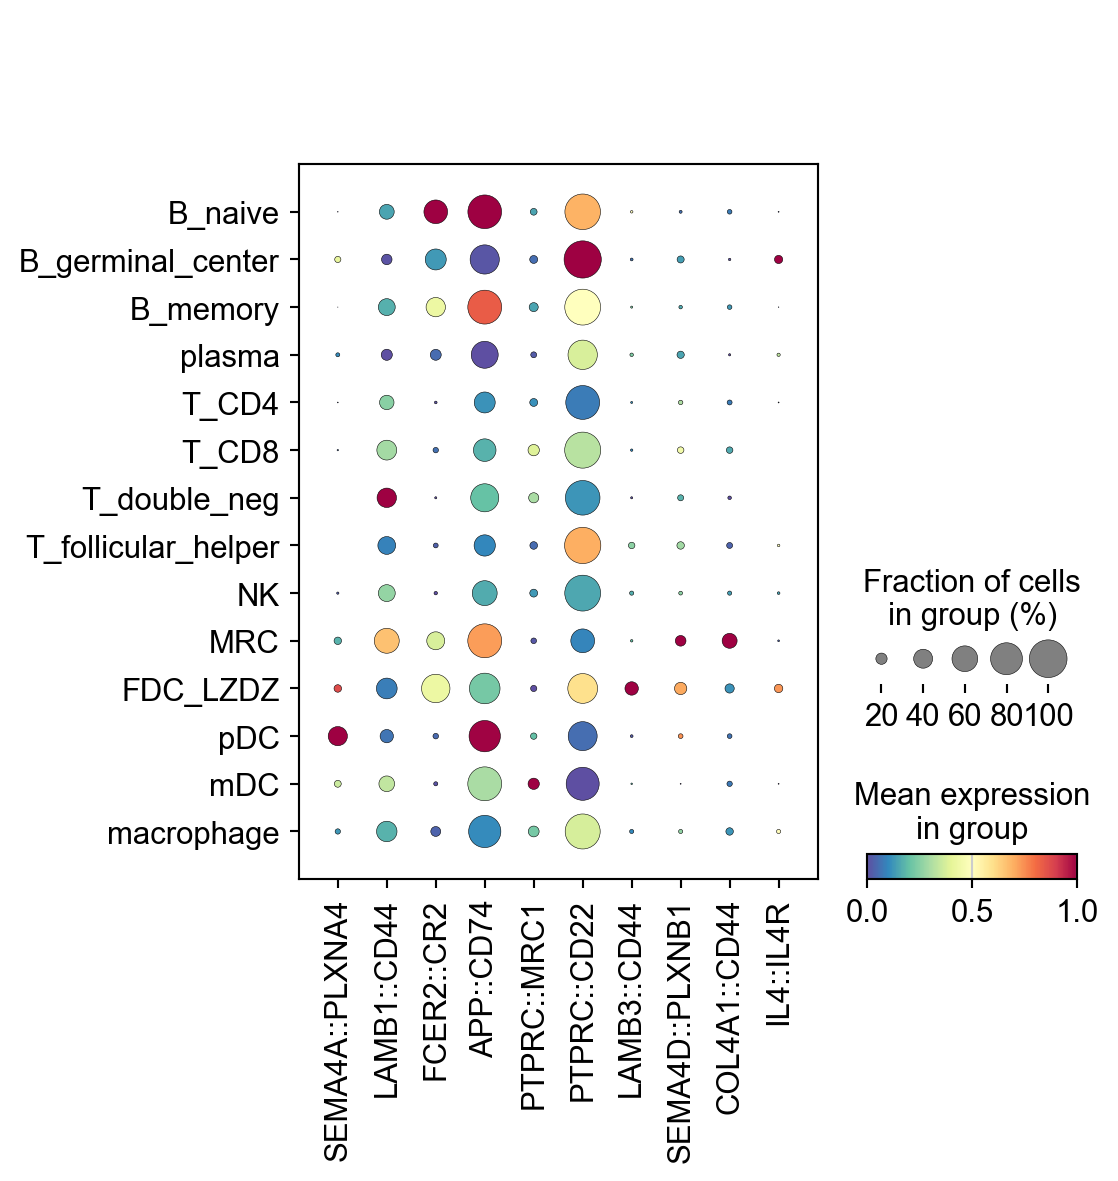
[24]:
sc.pl.dotplot(lr_adata,
              LARIS_variable_interactions.index[:10],
              groupby='cell_type',
             standard_scale='var',
             cmap='Spectral_r')
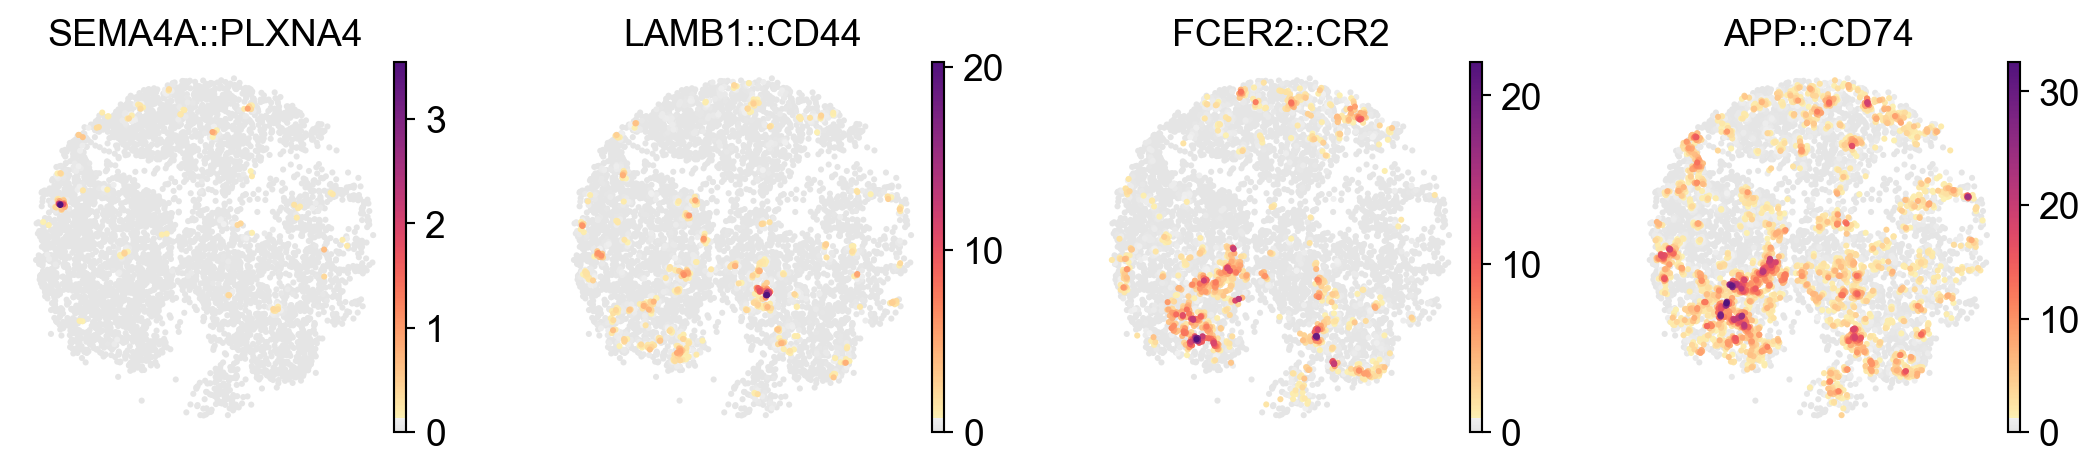
[25]:
x_width=adata.obsm['X_spatial'][:,0].max()-adata.obsm['X_spatial'][:,0].min()
y_width=adata.obsm['X_spatial'][:,1].max()-adata.obsm['X_spatial'][:,1].min()

plt.rcParams['figure.figsize'] = 2.5, 2.5*y_width/x_width

sc.pl.embedding(
    lr_adata,
    basis='X_spatial',
    color=LARIS_variable_interactions.index[:4],
    cmap=pos_cmap,
 #   vmin=1,
  #  vmax=1.5,
      # palette=self_palette2,
       ncols=4,
    # size=80,
    frameon=False)
plt.rcParams['figure.figsize'] = 4, 4
Check the cell type-level ligand-receptor interaction inferred by LARIS#
[26]:
res_LARIS.head(10)
[26]:
| sender | receiver | interaction_score | ligand | receptor | interaction_name | p_value | p_value_fdr | nlog10_p_value_fdr | |
|---|---|---|---|---|---|---|---|---|---|
| 0 | B_naive | B_naive | 0.900057 | FCER2 | CR2 | FCER2::CR2 | 0.000999 | 0.010570 | 1.975922 |
| 1 | B_memory | B_memory | 0.538235 | COL4A3 | CD44 | COL4A3::CD44 | 0.000999 | 0.012469 | 1.904168 |
| 2 | B_germinal_center | B_germinal_center | 0.397066 | SEMA4A | PLXNB2 | SEMA4A::PLXNB2 | 0.000999 | 0.014026 | 1.853067 |
| 3 | T_double_neg | NK | 0.344916 | CLEC2D | KLRB1 | CLEC2D::KLRB1 | 0.000999 | 0.009419 | 2.025989 |
| 4 | B_memory | B_naive | 0.337151 | COL4A3 | CD44 | COL4A3::CD44 | 0.000999 | 0.012947 | 1.887830 |
| 5 | B_memory | B_memory | 0.324935 | COL4A4 | CD44 | COL4A4::CD44 | 0.000999 | 0.012469 | 1.904168 |
| 6 | B_memory | B_memory | 0.282586 | SEMA7A | PLXNC1 | SEMA7A::PLXNC1 | 0.000999 | 0.012469 | 1.904168 |
| 7 | pDC | B_naive | 0.276228 | APP | CD74 | APP::CD74 | 0.000999 | 0.009686 | 2.013857 |
| 8 | B_naive | B_naive | 0.258380 | APP | CD74 | APP::CD74 | 0.033966 | 0.270686 | 0.567535 |
| 9 | B_memory | B_naive | 0.244977 | APP | CD74 | APP::CD74 | 0.026973 | 0.292850 | 0.533355 |
[27]:
res_LARIS.head(10)
[27]:
| sender | receiver | interaction_score | ligand | receptor | interaction_name | p_value | p_value_fdr | nlog10_p_value_fdr | |
|---|---|---|---|---|---|---|---|---|---|
| 0 | B_naive | B_naive | 0.900057 | FCER2 | CR2 | FCER2::CR2 | 0.000999 | 0.010570 | 1.975922 |
| 1 | B_memory | B_memory | 0.538235 | COL4A3 | CD44 | COL4A3::CD44 | 0.000999 | 0.012469 | 1.904168 |
| 2 | B_germinal_center | B_germinal_center | 0.397066 | SEMA4A | PLXNB2 | SEMA4A::PLXNB2 | 0.000999 | 0.014026 | 1.853067 |
| 3 | T_double_neg | NK | 0.344916 | CLEC2D | KLRB1 | CLEC2D::KLRB1 | 0.000999 | 0.009419 | 2.025989 |
| 4 | B_memory | B_naive | 0.337151 | COL4A3 | CD44 | COL4A3::CD44 | 0.000999 | 0.012947 | 1.887830 |
| 5 | B_memory | B_memory | 0.324935 | COL4A4 | CD44 | COL4A4::CD44 | 0.000999 | 0.012469 | 1.904168 |
| 6 | B_memory | B_memory | 0.282586 | SEMA7A | PLXNC1 | SEMA7A::PLXNC1 | 0.000999 | 0.012469 | 1.904168 |
| 7 | pDC | B_naive | 0.276228 | APP | CD74 | APP::CD74 | 0.000999 | 0.009686 | 2.013857 |
| 8 | B_naive | B_naive | 0.258380 | APP | CD74 | APP::CD74 | 0.033966 | 0.270686 | 0.567535 |
| 9 | B_memory | B_naive | 0.244977 | APP | CD74 | APP::CD74 | 0.026973 | 0.292850 | 0.533355 |
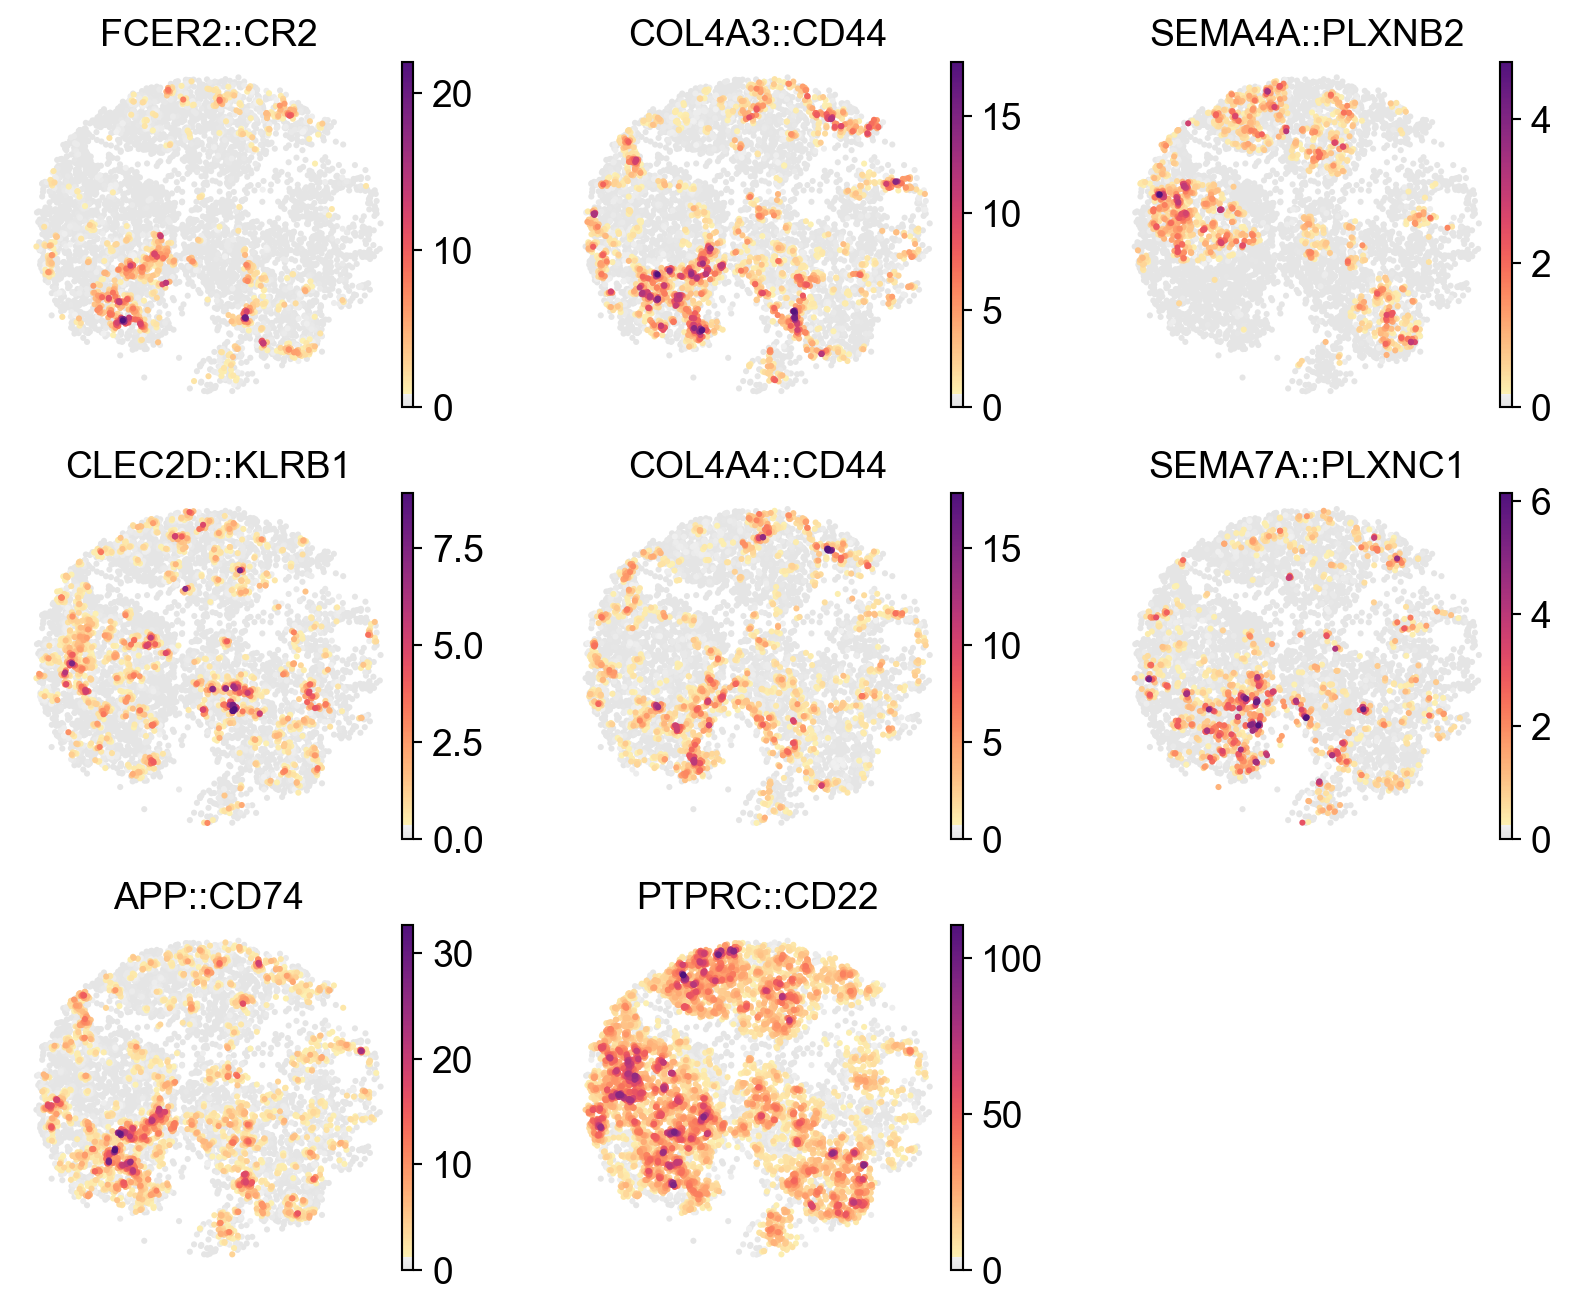
[28]:
x_width=adata.obsm['X_spatial'][:,0].max()-adata.obsm['X_spatial'][:,0].min()
y_width=adata.obsm['X_spatial'][:,1].max()-adata.obsm['X_spatial'][:,1].min()

plt.rcParams['figure.figsize'] = 2.5, 2.5*y_width/x_width

sc.pl.embedding(
    lr_adata,
    basis='X_spatial',
    color=res_LARIS['interaction_name'][:12].unique(),
    cmap=pos_cmap,
 #   vmin=1,
  #  vmax=1.5,
      # palette=self_palette2,
       ncols=3,
      # size=80,
    frameon=False)
plt.rcParams['figure.figsize'] = 4, 4
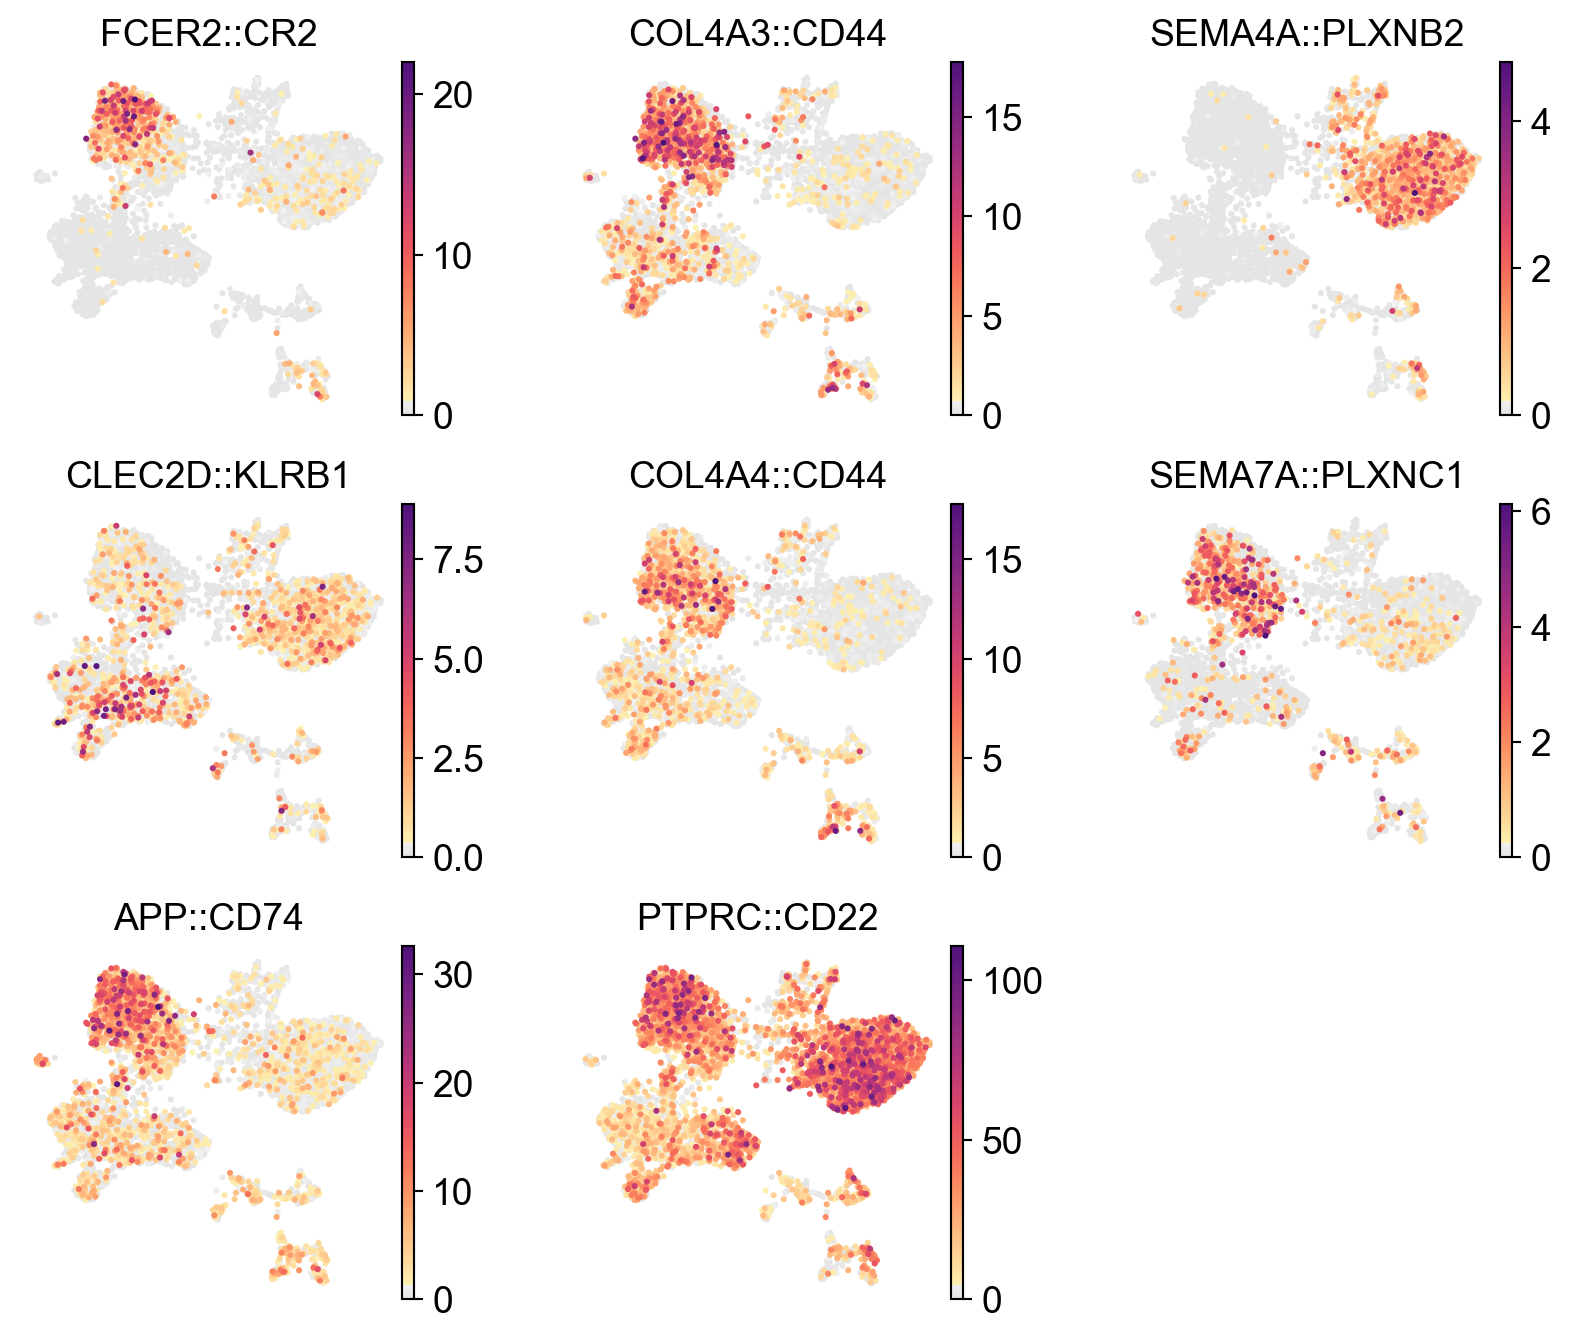
[29]:
x_width=lr_adata.obsm['X_umap'][:,0].max()-lr_adata.obsm['X_umap'][:,0].min()
y_width=lr_adata.obsm['X_umap'][:,1].max()-lr_adata.obsm['X_umap'][:,1].min()

plt.rcParams['figure.figsize'] = 2.5, 2.5*y_width/x_width

sc.pl.embedding(
    lr_adata,
    basis='X_umap',
    color=res_LARIS['interaction_name'][:12].unique(),
    cmap=pos_cmap,
 #   vmin=1,
  #  vmax=1.5,
      # palette=self_palette2,
       ncols=3,
    # size=50,
    frameon=False)
plt.rcParams['figure.figsize'] = 4, 4
Filter hits by ligand/receptor/cell type#
[30]:
res_LARIS[res_LARIS['sender'] == 'MRC'].head(10)
[30]:
| sender | receiver | interaction_score | ligand | receptor | interaction_name | p_value | p_value_fdr | nlog10_p_value_fdr | |
|---|---|---|---|---|---|---|---|---|---|
| 17 | MRC | T_CD4 | 0.184022 | CCL21 | CCR7 | CCL21::CCR7 | 0.000999 | 0.016983 | 1.769986 |
| 37 | MRC | T_CD4 | 0.137322 | CCL19 | CCR7 | CCL19::CCR7 | 0.030969 | 0.324221 | 0.489159 |
| 59 | MRC | B_memory | 0.098216 | COL1A1 | CD44 | COL1A1::CD44 | 0.000999 | 0.013820 | 1.859508 |
| 65 | MRC | T_CD4 | 0.090855 | COL1A1 | CD44 | COL1A1::CD44 | 0.000999 | 0.016983 | 1.769986 |
| 71 | MRC | T_CD4 | 0.083999 | LAMA4 | CD44 | LAMA4::CD44 | 0.028971 | 0.324221 | 0.489159 |
| 73 | MRC | T_double_neg | 0.083307 | LAMA4 | CD44 | LAMA4::CD44 | 0.000999 | 0.008891 | 2.051045 |
| 84 | MRC | B_memory | 0.069352 | COL1A2 | CD44 | COL1A2::CD44 | 0.000999 | 0.013820 | 1.859508 |
| 90 | MRC | T_CD8 | 0.065867 | COL1A2 | CD44 | COL1A2::CD44 | 0.000999 | 0.013362 | 1.874141 |
| 101 | MRC | T_CD8 | 0.056886 | LAMA4 | CD44 | LAMA4::CD44 | 0.000999 | 0.013362 | 1.874141 |
| 116 | MRC | T_CD4 | 0.050082 | COL1A2 | CD44 | COL1A2::CD44 | 0.103896 | 0.483723 | 0.315404 |
Look for enrichment in different tissue regions#
[31]:
# Import cosg, could also use a Wilcoxon test as well to find region enrichment
import cosg
[32]:
adata.obs.head().T
[32]:
| AAACCCAAGCGCCTTG-1 | AAACCCAAGTGGACGT-1 | AAACCCACAGAAGTGC-1 | AAACCCAGTCATTGCA-1 | AAACCCATCATCGCAA-1 | |
|---|---|---|---|---|---|
| n_genes_by_counts | 1042 | 2382 | 3734 | 1928 | 441 |
| log1p_n_genes_by_counts | 6.949856 | 7.776115 | 8.225503 | 7.564757 | 6.09131 |
| total_counts | 1495.0 | 4036.0 | 7292.0 | 3039.0 | 554.0 |
| log1p_total_counts | 7.31055 | 8.303257 | 8.89467 | 8.019613 | 6.318968 |
| pct_counts_in_top_50_genes | 18.795987 | 15.237859 | 9.421284 | 13.754525 | 27.617329 |
| pct_counts_in_top_100_genes | 27.826087 | 21.382557 | 14.413055 | 20.500165 | 38.447653 |
| pct_counts_in_top_200_genes | 41.204013 | 30.401388 | 21.969281 | 30.404738 | 56.498195 |
| pct_counts_in_top_500_genes | 63.745819 | 47.59663 | 38.137685 | 50.70747 | 100.0 |
| total_counts_mt | 3.0 | 8.0 | 100.0 | 31.0 | 2.0 |
| log1p_total_counts_mt | 1.386294 | 2.197225 | 4.61512 | 3.465736 | 1.098612 |
| pct_counts_mt | 0.200669 | 0.198216 | 1.371366 | 1.020072 | 0.361011 |
| total_counts_ribo | 87.0 | 73.0 | 364.0 | 232.0 | 45.0 |
| log1p_total_counts_ribo | 4.477337 | 4.304065 | 5.899898 | 5.451038 | 3.828641 |
| pct_counts_ribo | 5.819398 | 1.808722 | 4.991772 | 7.63409 | 8.122744 |
| n_genes | 1042 | 2382 | 3734 | 1928 | 441 |
| cell_type | T_CD4 | plasma | B_germinal_center | B_naive | B_memory |
| region_name | Paracortex | Dark Zone | Light Zone | Marginal Zone | Interfollicular Zone |
[33]:
# Run cosg to identify markers
n_gene=30 # number of genes to save
groupby='region_name'
cosg.cosg(lr_adata,
    key_added='cosg',
    mu=100,
    expressed_pct=0.15, # minimum % of expression to make cut off
    remove_lowly_expressed=True,
    n_genes_user=100, # How many genes to append
    groupby=groupby)
[34]:
sc.tl.dendrogram(lr_adata, groupby=groupby, use_rep='X_pca')
df_tmp=pd.DataFrame(lr_adata.uns['cosg']['names'][:8,]).T
df_tmp=df_tmp.reindex(lr_adata.uns['dendrogram_'+groupby]['categories_ordered'])
marker_genes_list={idx: list(row.values) for idx, row in df_tmp.iterrows()}
marker_genes_list = {k: v for k, v in marker_genes_list.items() if not any(isinstance(x, float) for x in v)}
Storing dendrogram info using `.uns['dendrogram_region_name']`
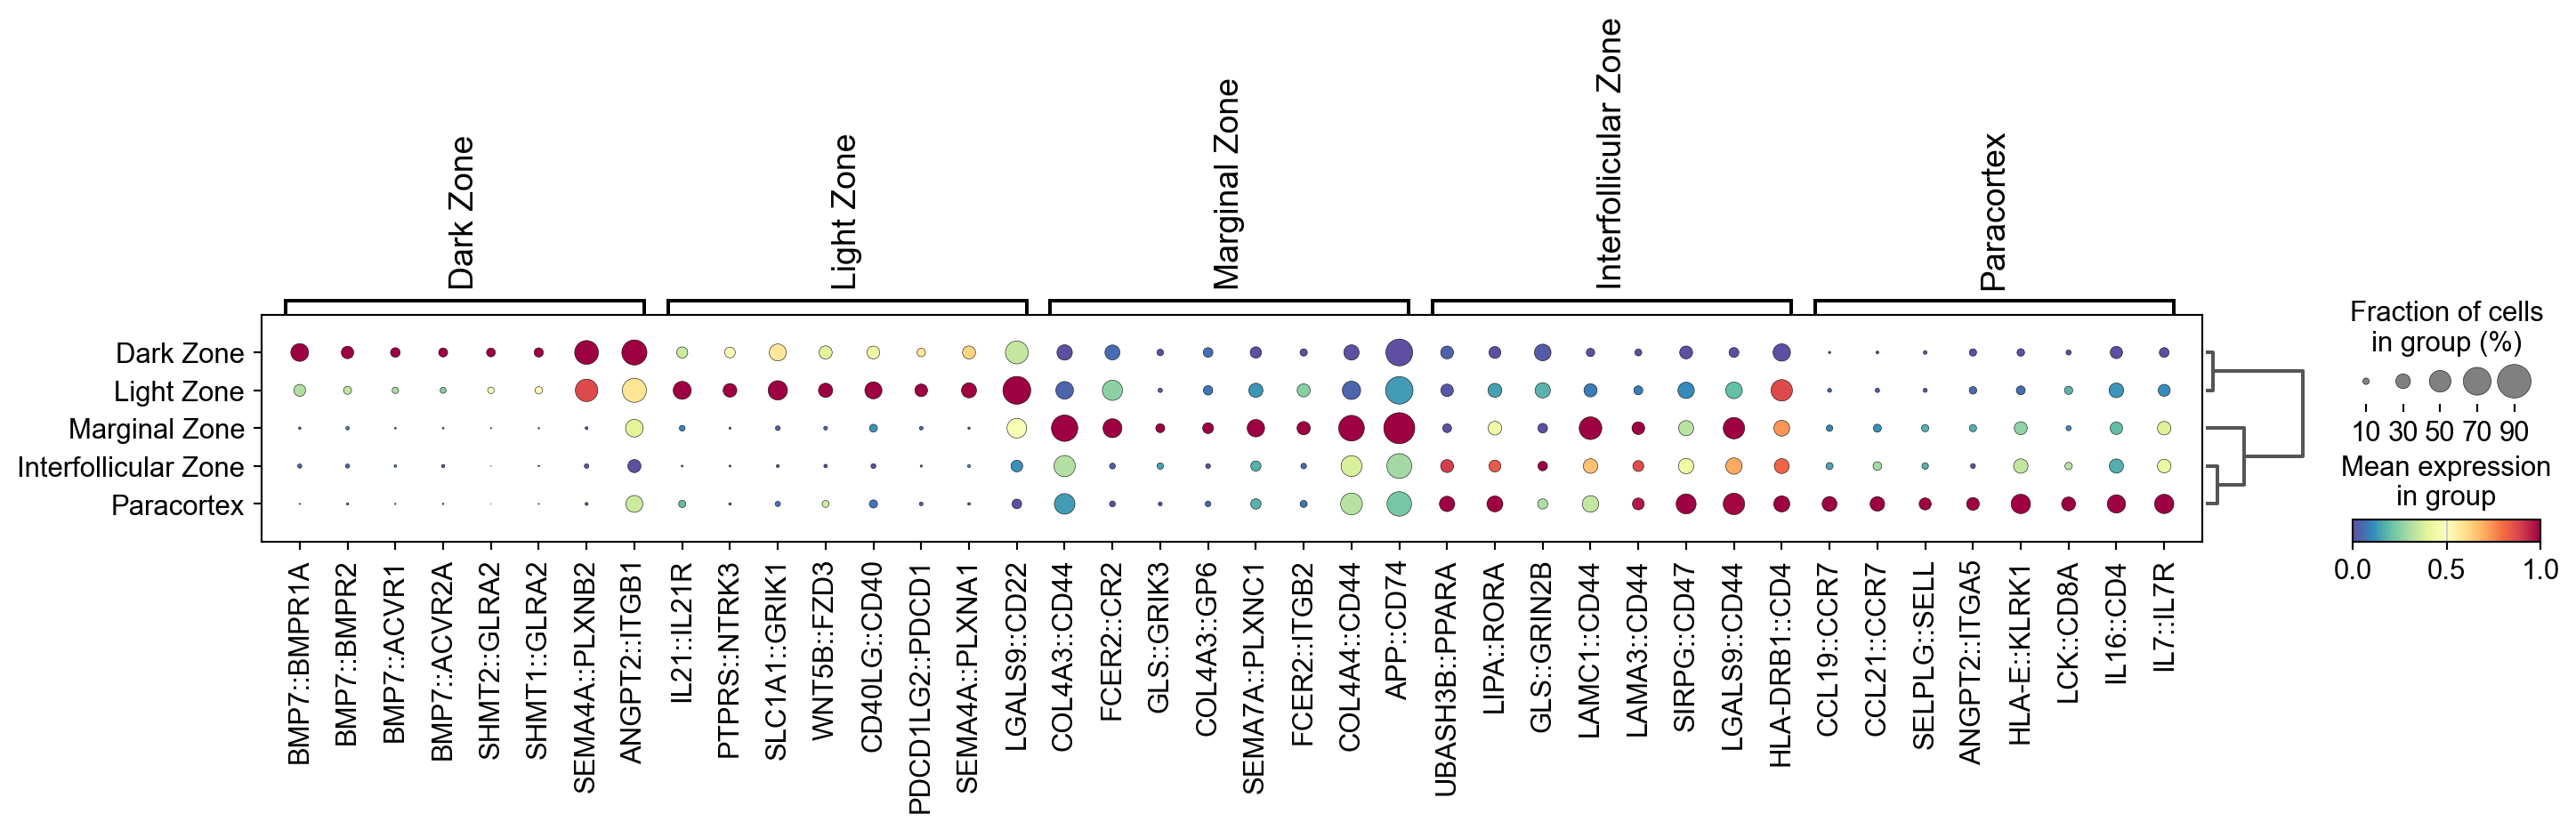
[35]:
sc.pl.dotplot(lr_adata, marker_genes_list,
             groupby=groupby,
             dendrogram=True,
            swap_axes=False,
             standard_scale='var',
             cmap='Spectral_r')
Visualize the ligand-receptor interaction score in spatial plots#
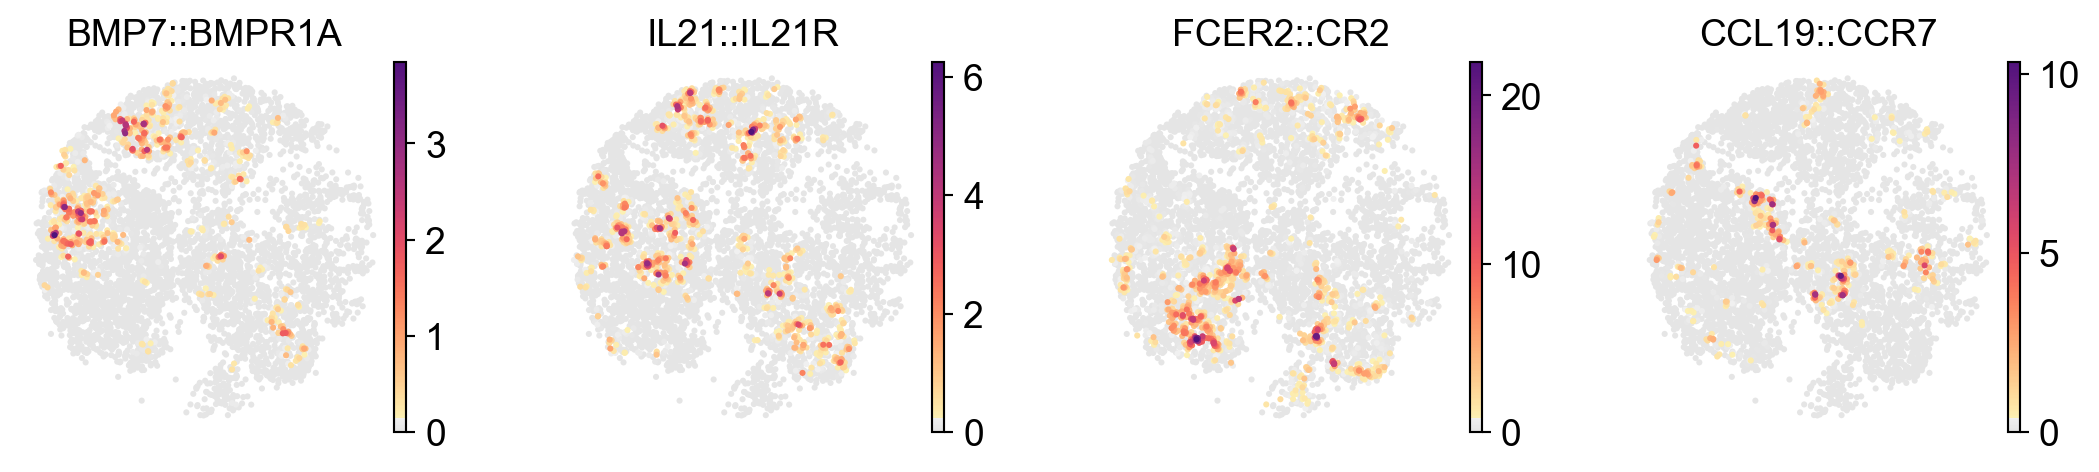
[36]:
x_width=adata.obsm['X_spatial'][:,0].max()-adata.obsm['X_spatial'][:,0].min()
y_width=adata.obsm['X_spatial'][:,1].max()-adata.obsm['X_spatial'][:,1].min()

plt.rcParams['figure.figsize'] = 2.5, 2.5*y_width/x_width

sc.pl.embedding(
    lr_adata,
    basis='X_spatial',
    color=['BMP7::BMPR1A','IL21::IL21R','FCER2::CR2','CCL19::CCR7'],
    cmap=pos_cmap,
    ncols=4,
    # size=120,
    frameon=False)
plt.rcParams['figure.figsize'] = 4, 4
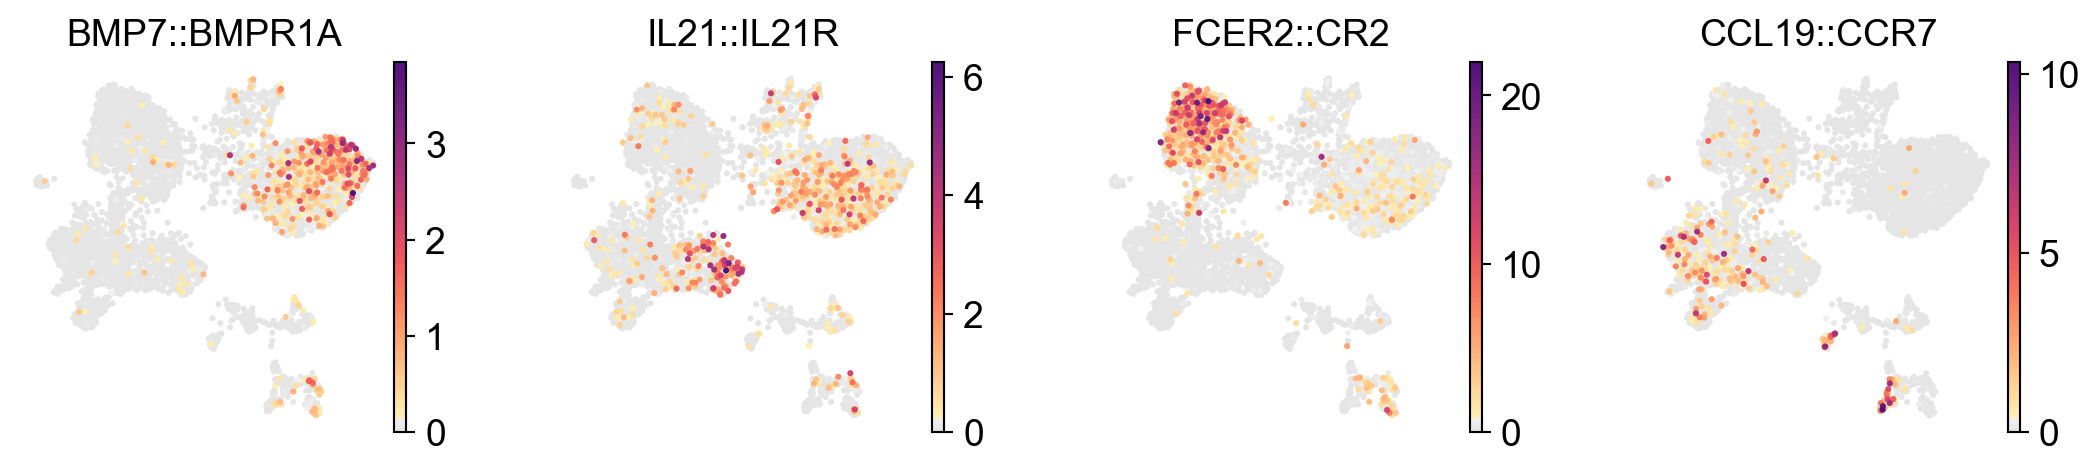
Visualize the ligand-receptor interaction score in UMAP plots#
[37]:
x_width=adata.obsm['X_spatial'][:,0].max()-adata.obsm['X_spatial'][:,0].min()
y_width=adata.obsm['X_spatial'][:,1].max()-adata.obsm['X_spatial'][:,1].min()

plt.rcParams['figure.figsize'] = 2.5, 2.5*y_width/x_width

sc.pl.embedding(
    lr_adata,
    basis='X_umap',
    color=['BMP7::BMPR1A','IL21::IL21R','FCER2::CR2','CCL19::CCR7'],
    cmap=pos_cmap,
    ncols=4,
    # size=60,
    frameon=False)
plt.rcParams['figure.figsize'] = 4, 4
Visualize LR interaction and cell-cell communication in dfferent ways#
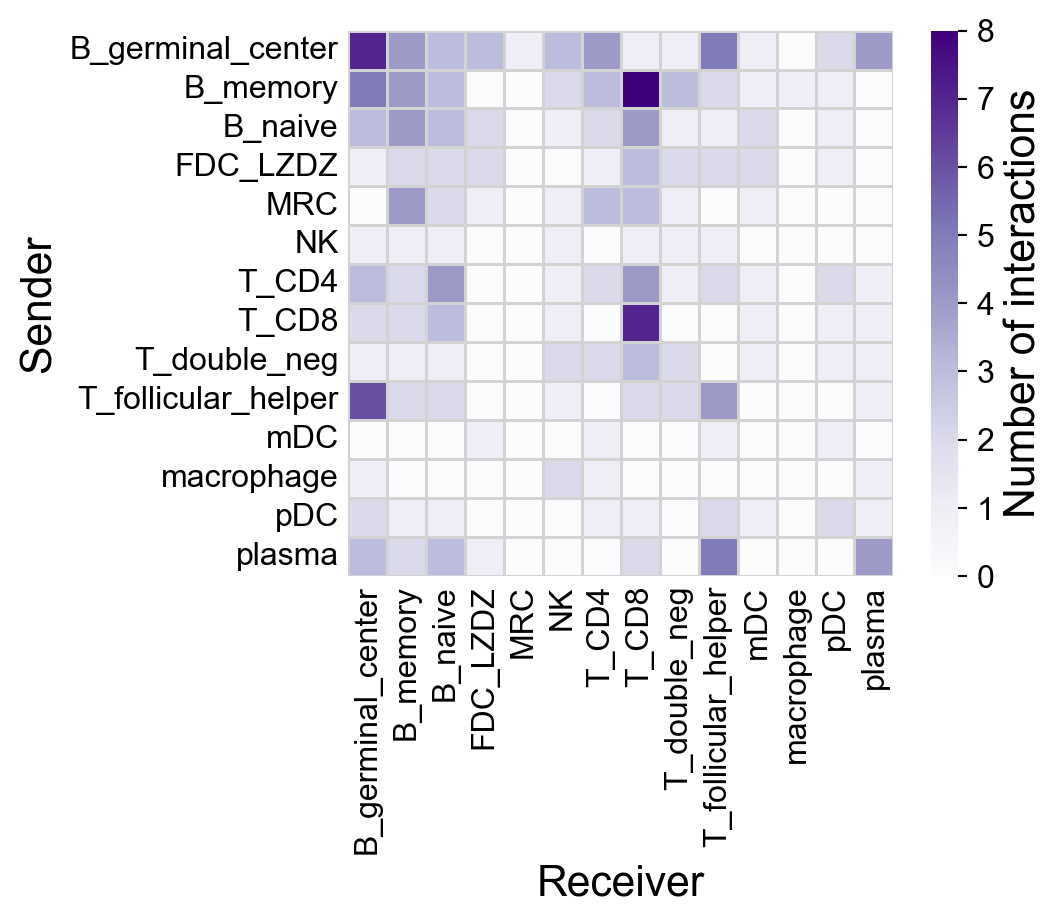
Cell-cell communication (CCC) Heatmap#
First, check the default settings:
[38]:
la.pl.plotCCCHeatmap(
    res_LARIS
)
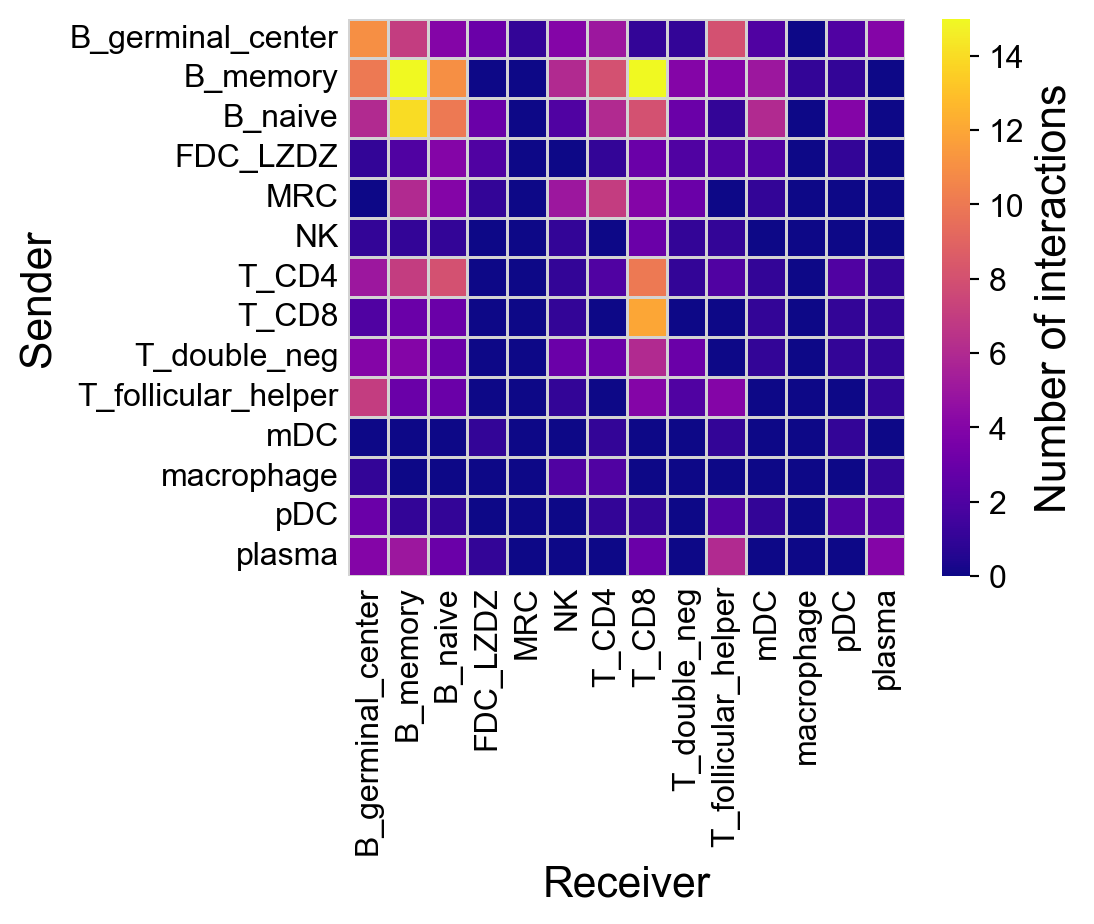
Use the top ones:
[39]:
fig=la.pl.plotCCCHeatmap(
    res_LARIS,
    cmap='plasma',
    filter_significant=False,
    n_top=2000,
)
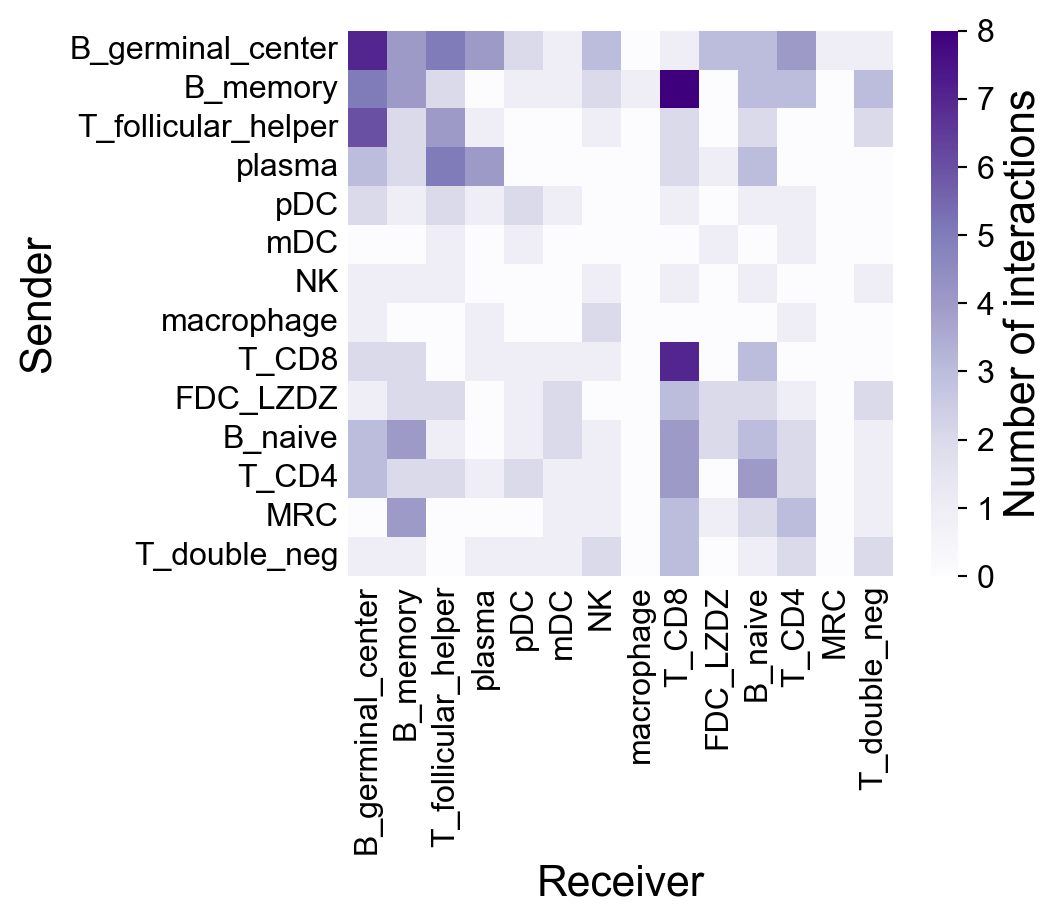
Filter by the p value and score:
[40]:
la.pl.plotCCCHeatmap(
    res_LARIS,
    cmap='Purples',
    # n_top=2000,
    figsize=(6, 5),
    axis_label_fontsize=16,
    tick_fontsize=12,
    cbar_label_fontsize=16,
    cbar_tick_fontsize=12,
    filter_significant=True,
    p_value_col='p_value_fdr',
    threshold=0.05,
    filter_by_interaction_score=True,
    threshold_interaction_score=0.01,
    show_borders=False,
    cluster=True,
)

Change the threshold:
[41]:
la.pl.plotCCCHeatmap(
    res_LARIS,
    cmap='Purples',
    # n_top=2000,
    figsize=(6, 5),
    axis_label_fontsize=16,
    tick_fontsize=12,
    cbar_label_fontsize=16,
    cbar_tick_fontsize=12,
    filter_significant=True,
    p_value_col='p_value_fdr',
    threshold=0.1,
    filter_by_interaction_score=True,
    threshold_interaction_score=0.01,
    show_borders=False,
    cluster=True,
)
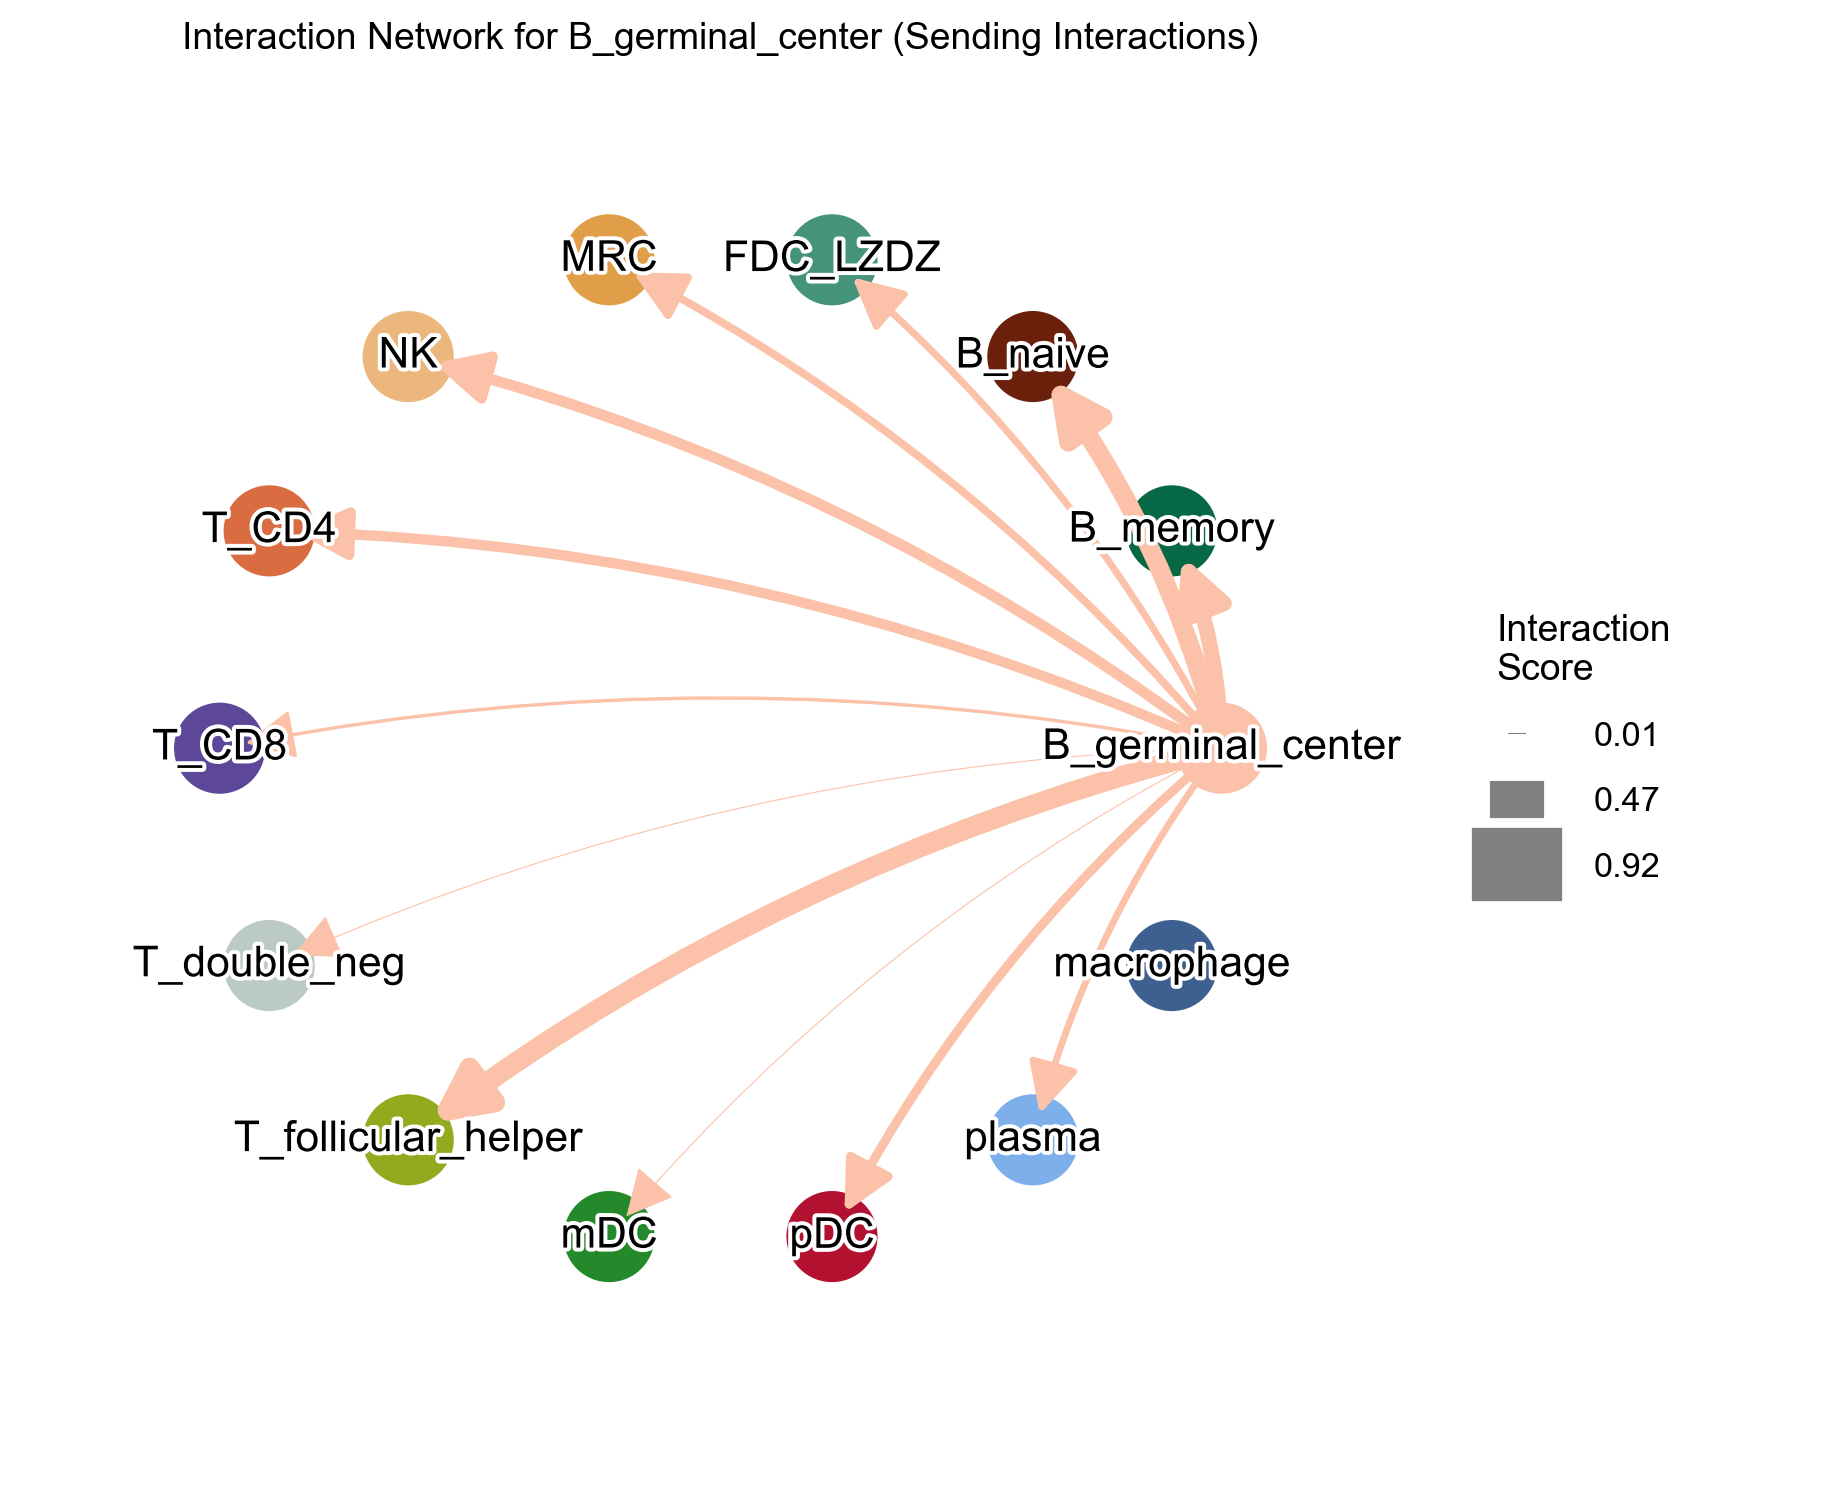
CCC Network#
First, check the default settings:
[42]:
la.pl.plotCCCNetwork(
    res_LARIS,
    'B_germinal_center',
    interaction_direction='sending',
    adata=adata,
)
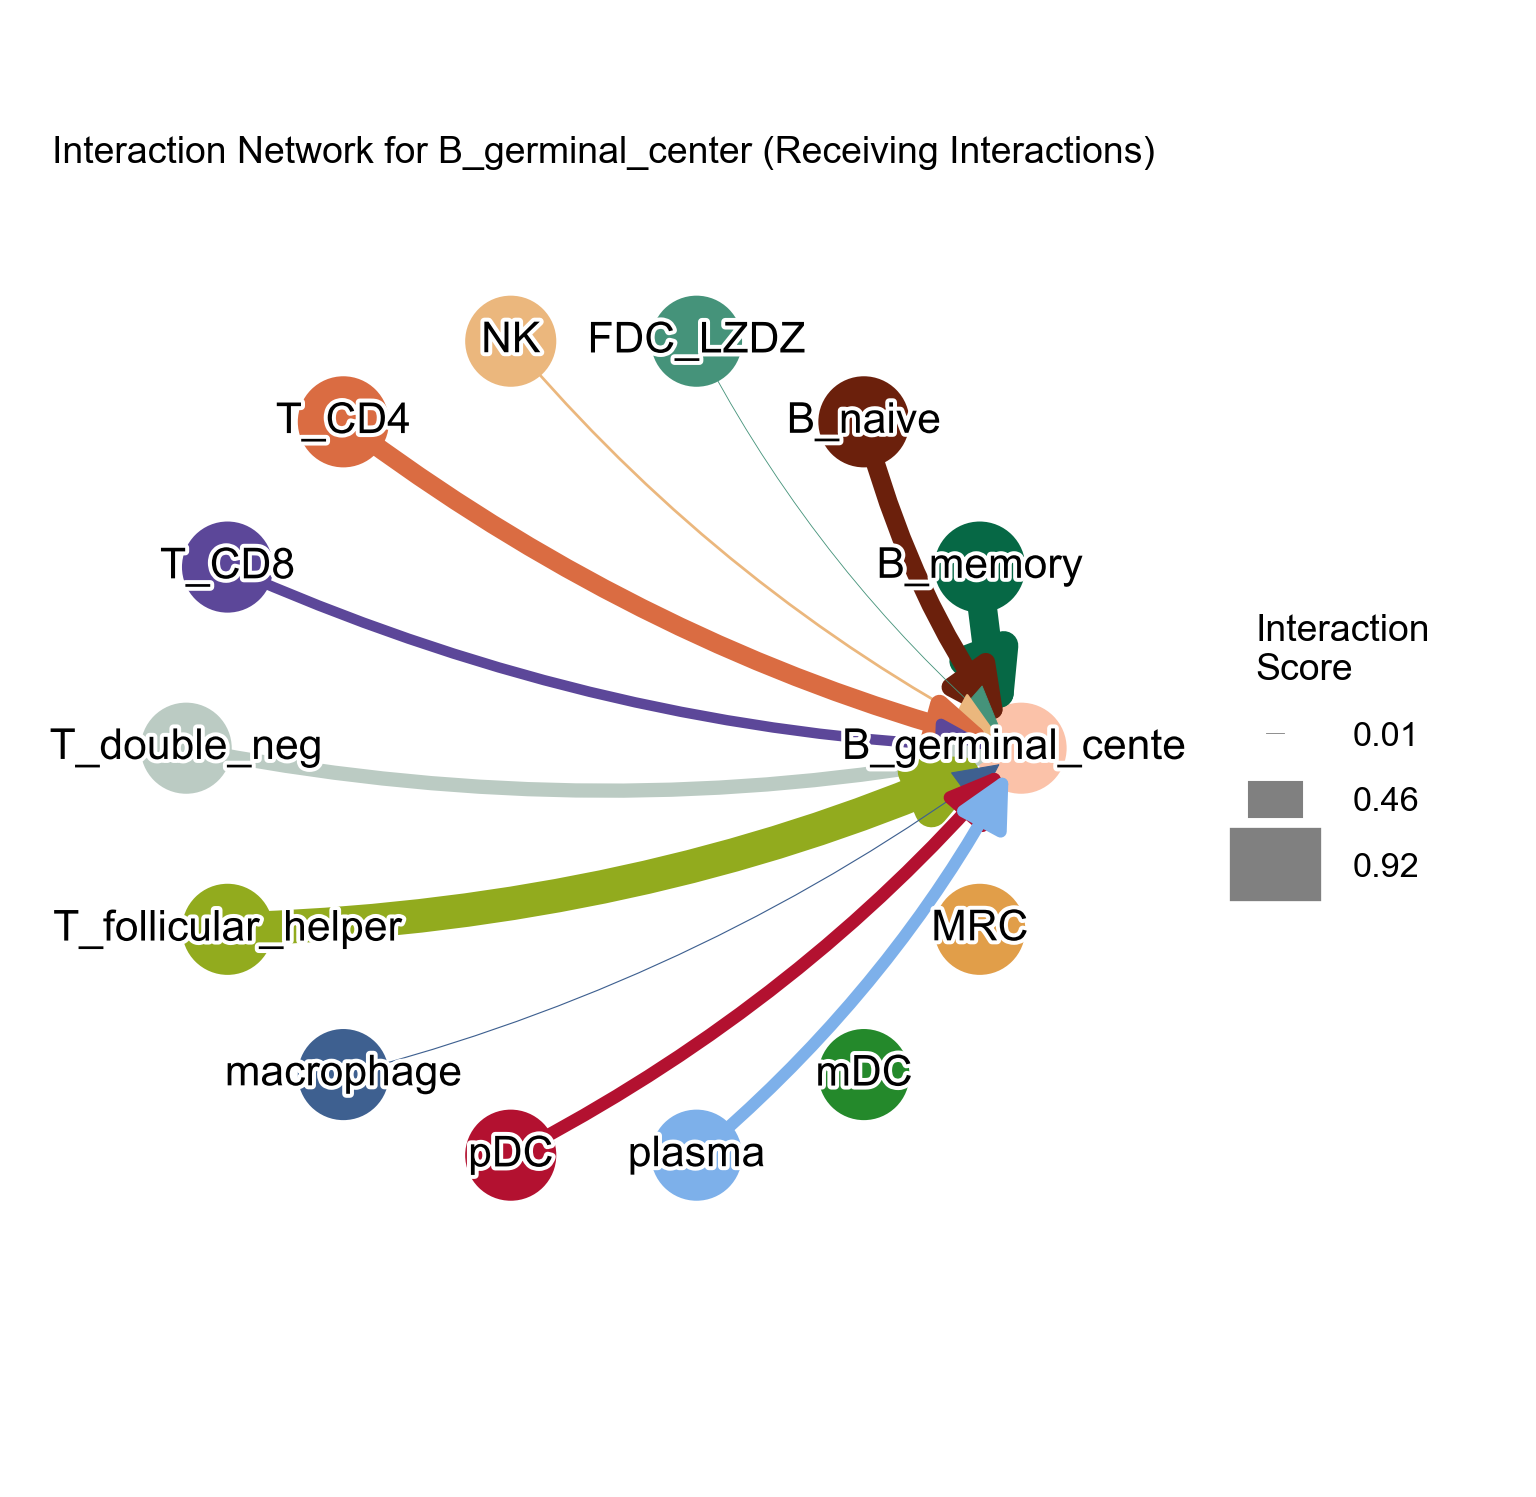
Check the receiving pattern for a target cell type:
[43]:
la.pl.plotCCCNetwork(
    res_LARIS,
    'B_germinal_center',
    interaction_direction='receiving',
    adata=adata,
    # edge_width_scale=20,
    # n_top=3000,
    filter_significant=True,
    p_value_col='p_value_fdr',
    threshold=0.05,
    filter_by_interaction_score=True,
    threshold_interaction_score=0.01,
    figsize=[10, 10],
)
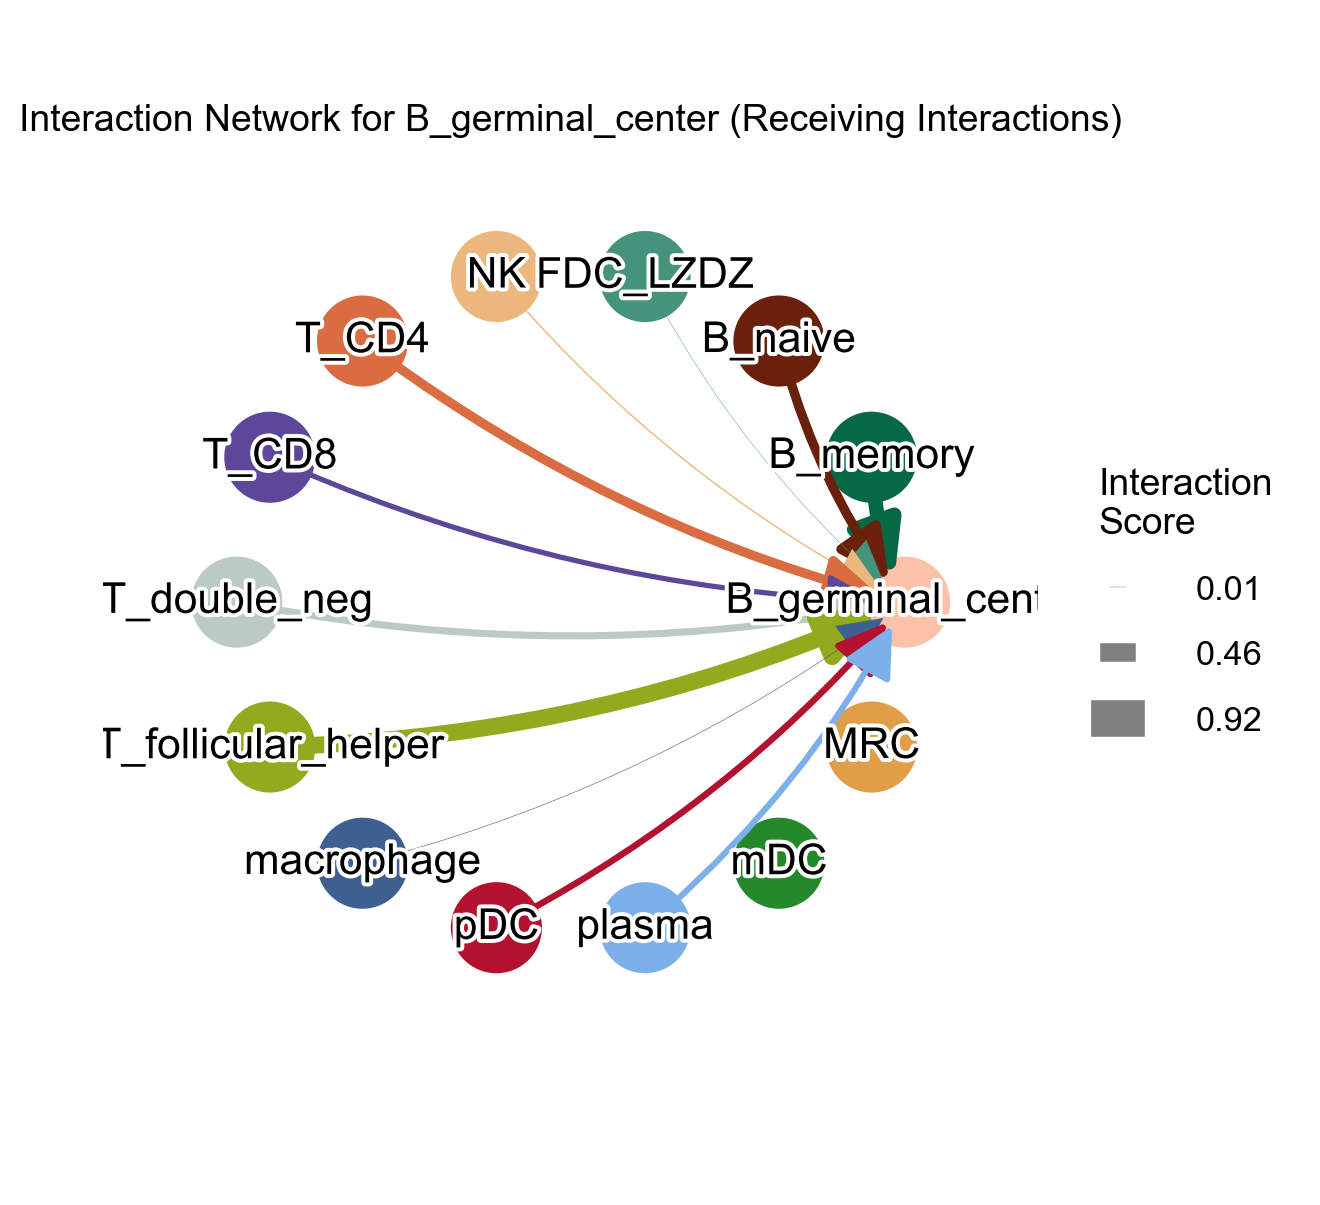
Adjust the edge_with_scale parameter and figsize parameter:
[44]:
la.pl.plotCCCNetwork(
    res_LARIS,
    'B_germinal_center',
    interaction_direction='receiving',
    adata=adata,
    edge_width_scale=15,
    # n_top=3000,
    filter_significant=True,
    p_value_col='p_value_fdr',
    threshold=0.05,
    filter_by_interaction_score=True,
    threshold_interaction_score=0.01,
    figsize=[8, 8],
)
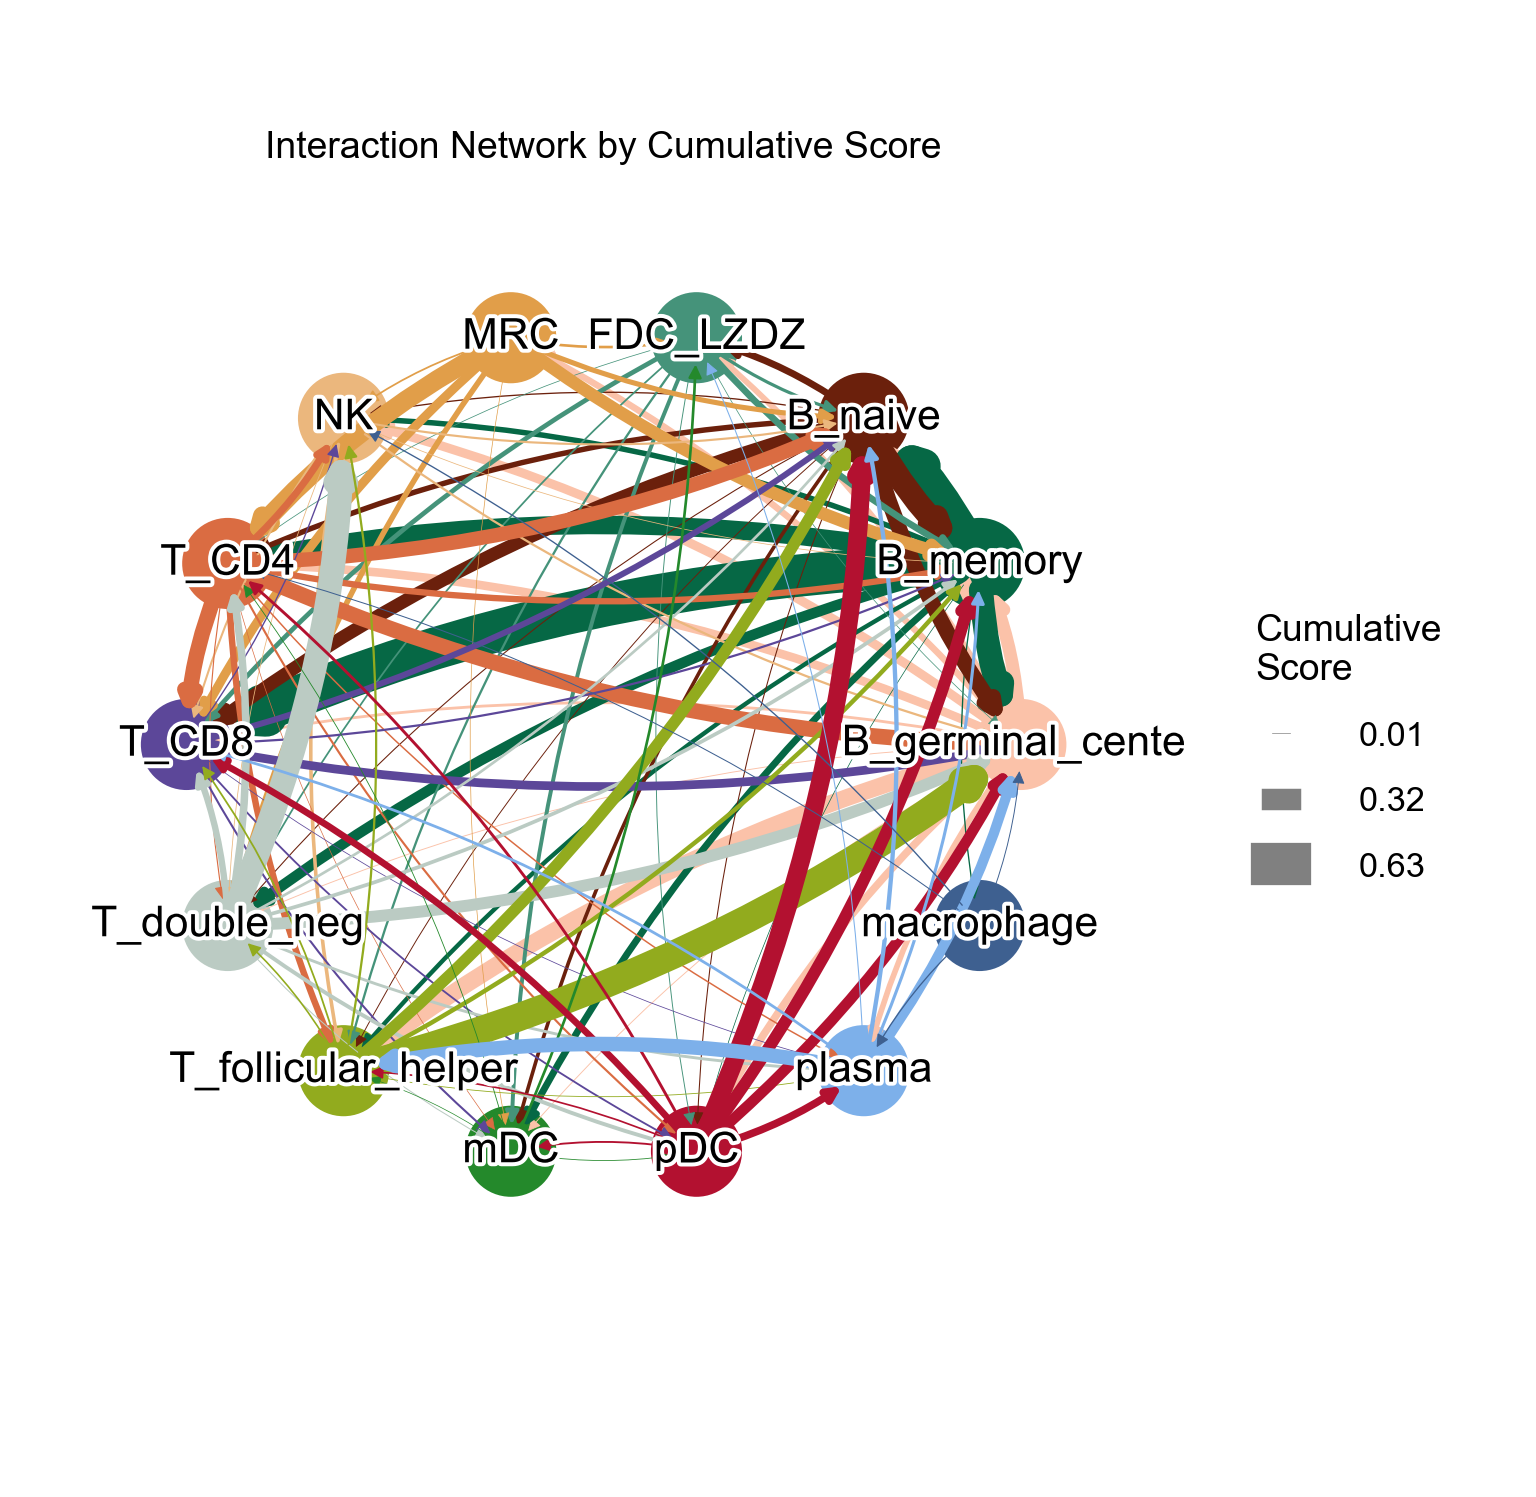
CCC Network (cumulative)#
[45]:
la.pl.plotCCCNetworkCumulative(
    res_LARIS,
    adata=adata,
    groupby='cell_type',
    filter_significant=True,
    p_value_col='p_value_fdr',
    threshold=0.05,
    filter_by_interaction_score=True,
    threshold_interaction_score=0.01,
    edge_width_scale=25,
    figsize=[10, 10],

)
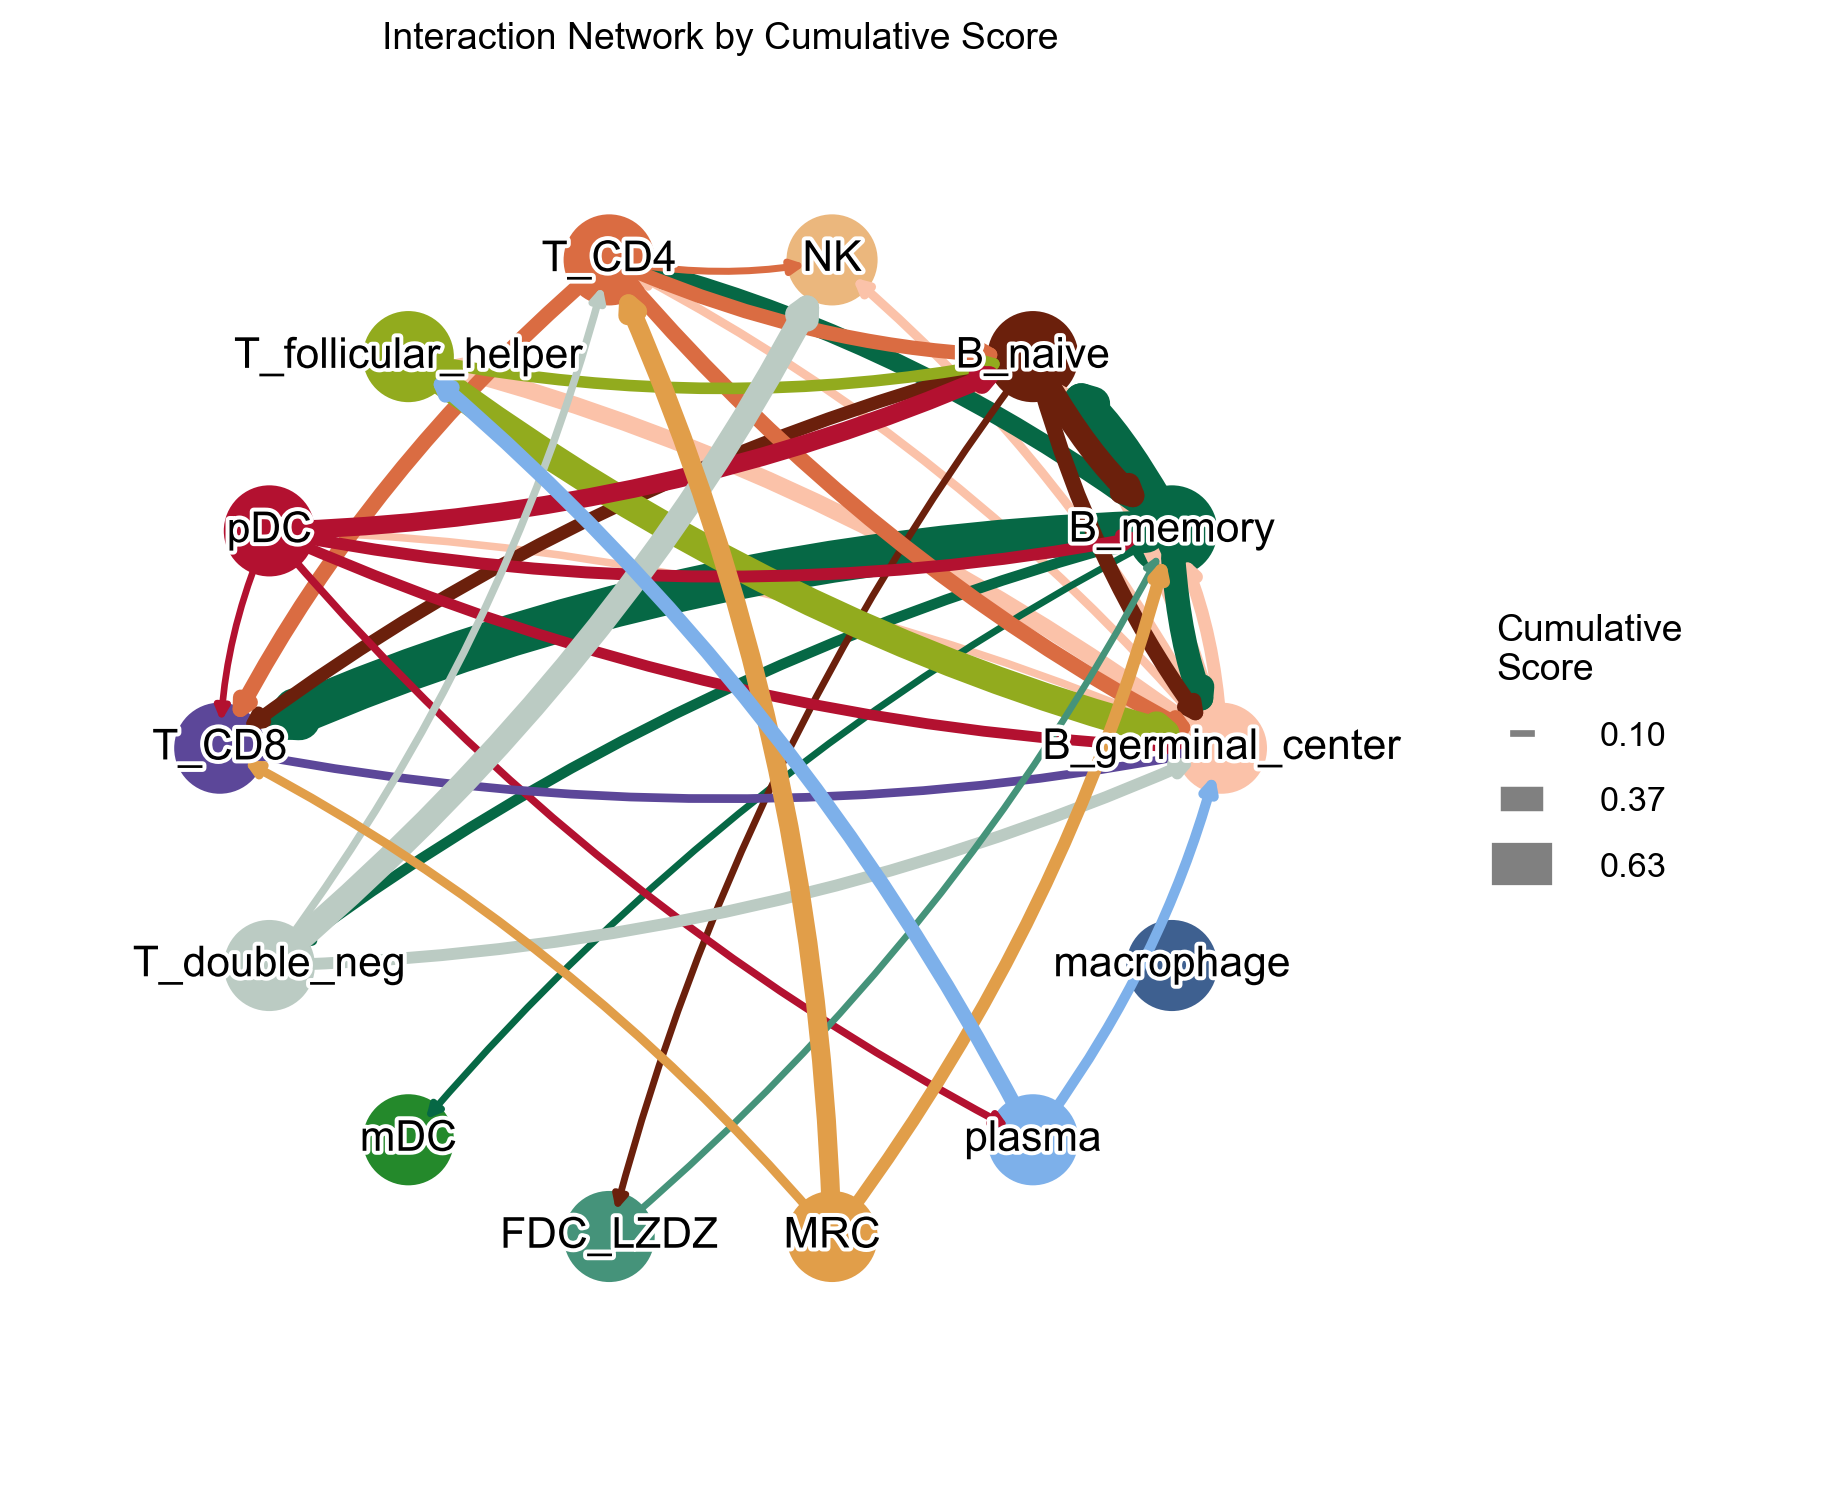
Add cutoff = 0.1 to filter out some edges:
[46]:
la.pl.plotCCCNetworkCumulative(
    res_LARIS,
    adata=adata,
    groupby='cell_type',
    filter_significant=True,
    p_value_col='p_value_fdr',
    threshold=0.05,
    filter_by_interaction_score=True,
    threshold_interaction_score=0.01,
    edge_width_scale=25,
    # figsize=[6, 6],
    cutoff=0.1,

)
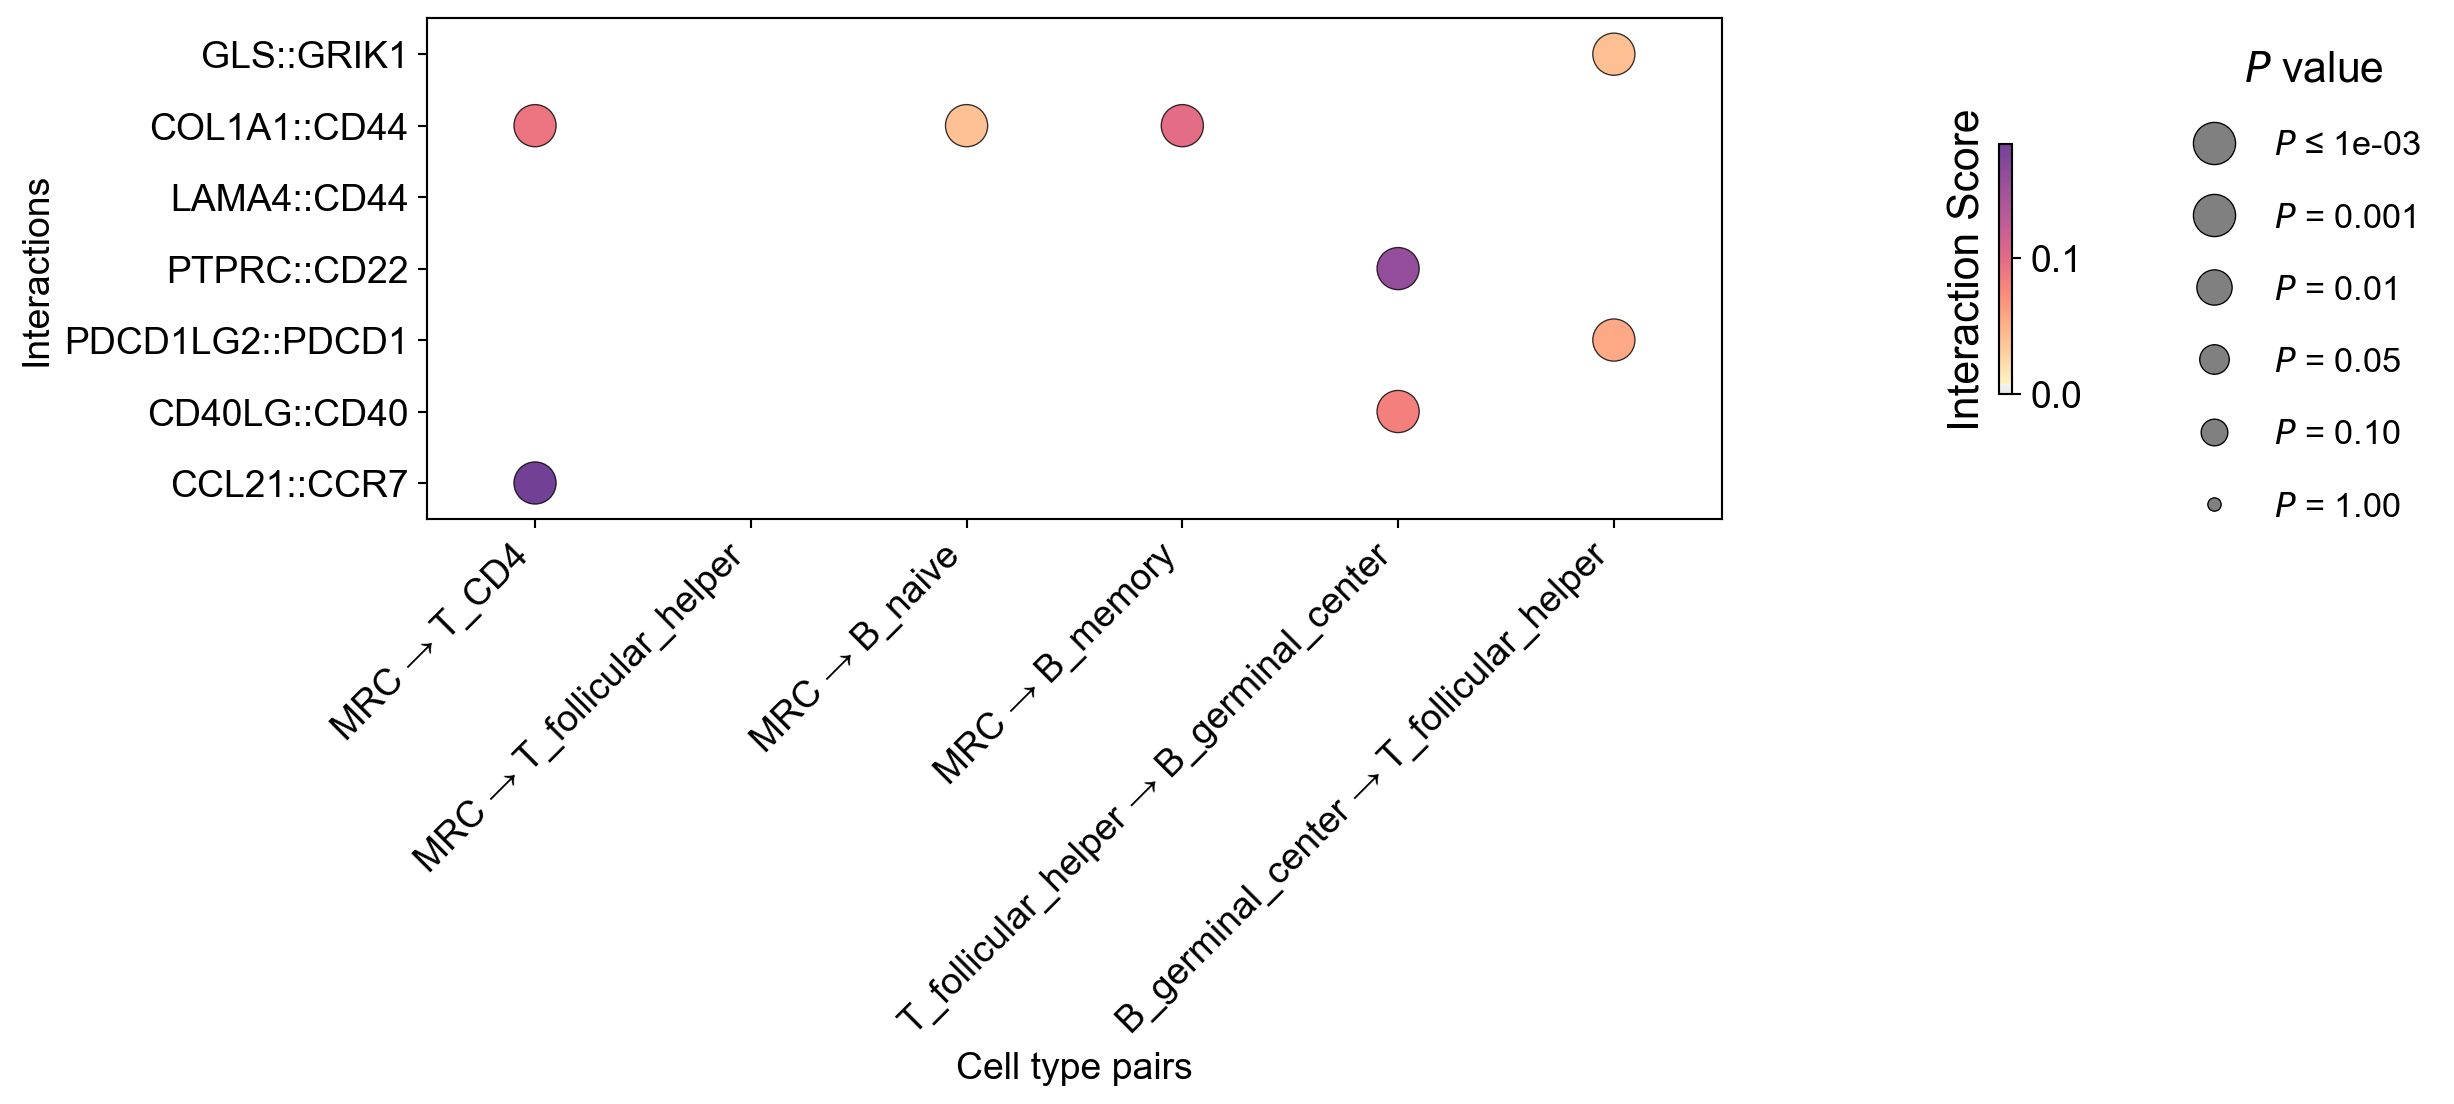
CCC DotPlot#
First, check the default:
[47]:
la.pl.plotCCCDotPlot(
    res_LARIS,
    interactions_to_plot=['CCL21::CCR7', "CD40LG::CD40",  "PDCD1LG2::PDCD1", "PTPRC::CD22", "LAMA4::CD44",
                        "COL1A1::CD44",
                        "GLS::GRIK1"],
    senders=["MRC", "MRC", "MRC", "MRC", "T_follicular_helper", "B_germinal_center"],
    receivers=["T_CD4", "T_follicular_helper", "B_naive", "B_memory",  "B_germinal_center",'T_follicular_helper'],
)
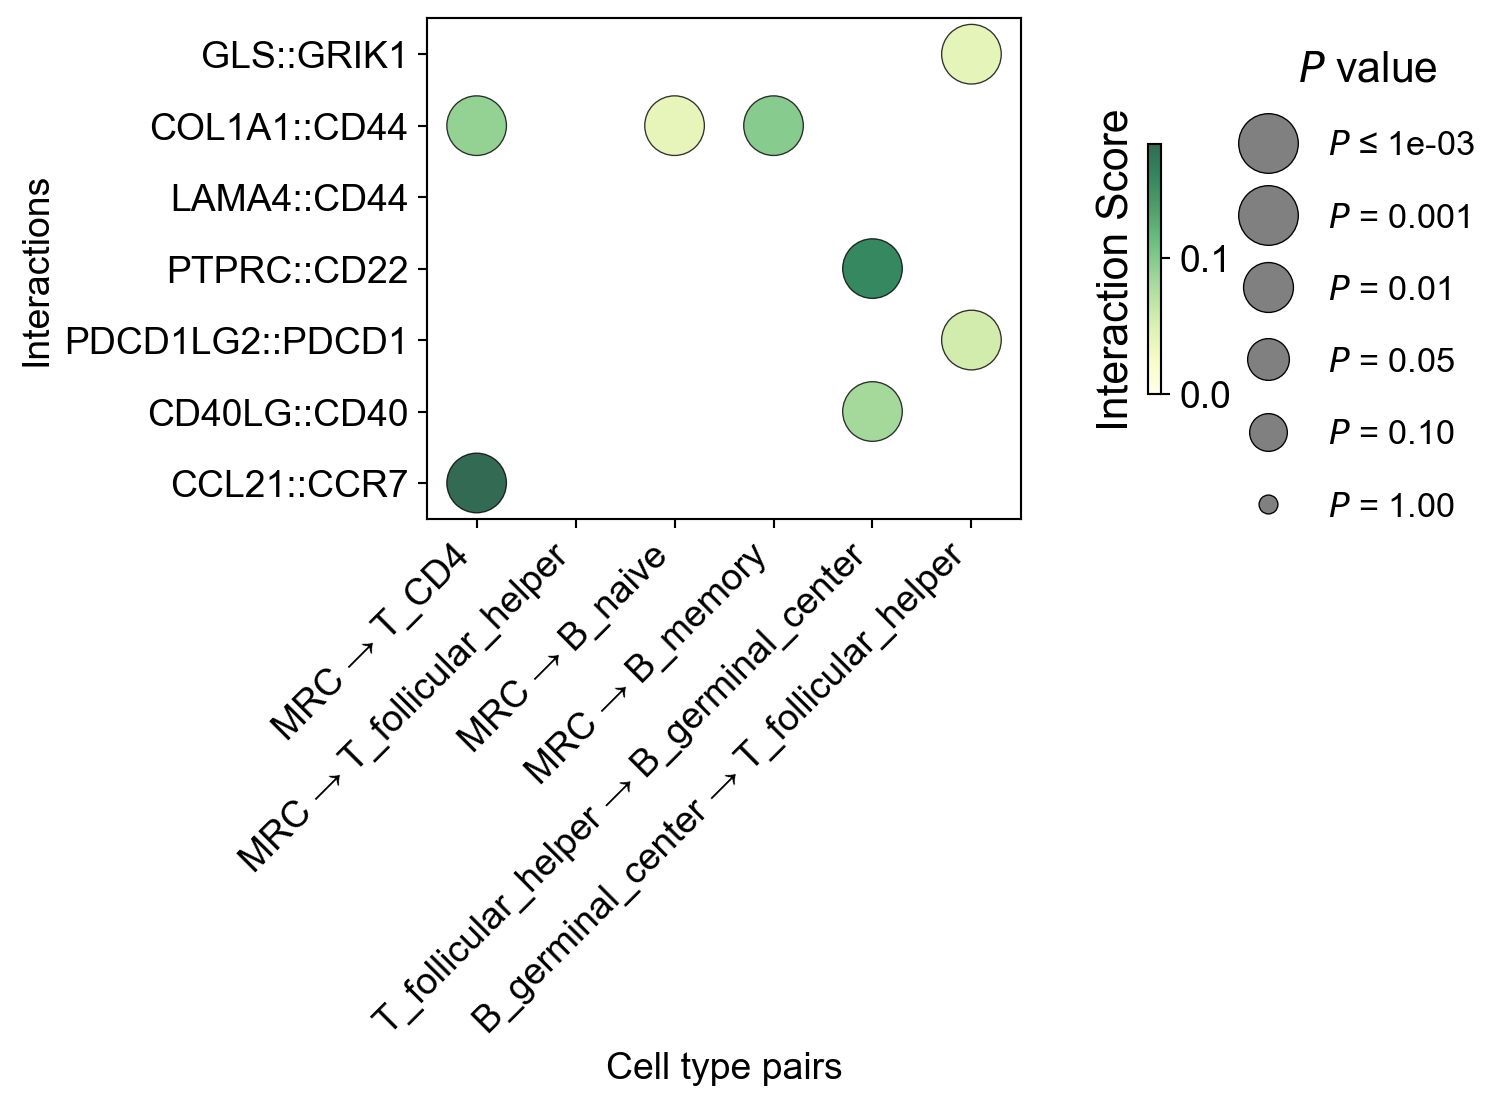
Adjust paramters for figsize and cmap:
[48]:
la.pl.plotCCCDotPlot(
    res_LARIS,
    interactions_to_plot=['CCL21::CCR7', "CD40LG::CD40",  "PDCD1LG2::PDCD1", "PTPRC::CD22", "LAMA4::CD44",
                        "COL1A1::CD44",
                        "GLS::GRIK1"],
    senders=["MRC", "MRC", "MRC", "MRC", "T_follicular_helper", "B_germinal_center"],
    receivers=["T_CD4", "T_follicular_helper", "B_naive", "B_memory",  "B_germinal_center",'T_follicular_helper'],

    # n_top=3000,
    bubble_size=500,
    cmap='YlGn',
    filter_significant=True,
    p_value_col='p_value_fdr',
    threshold=0.05,
    filter_by_interaction_score=True,
    threshold_interaction_score=0.01,
    figsize=[8,6],
    show_grid=False,
)
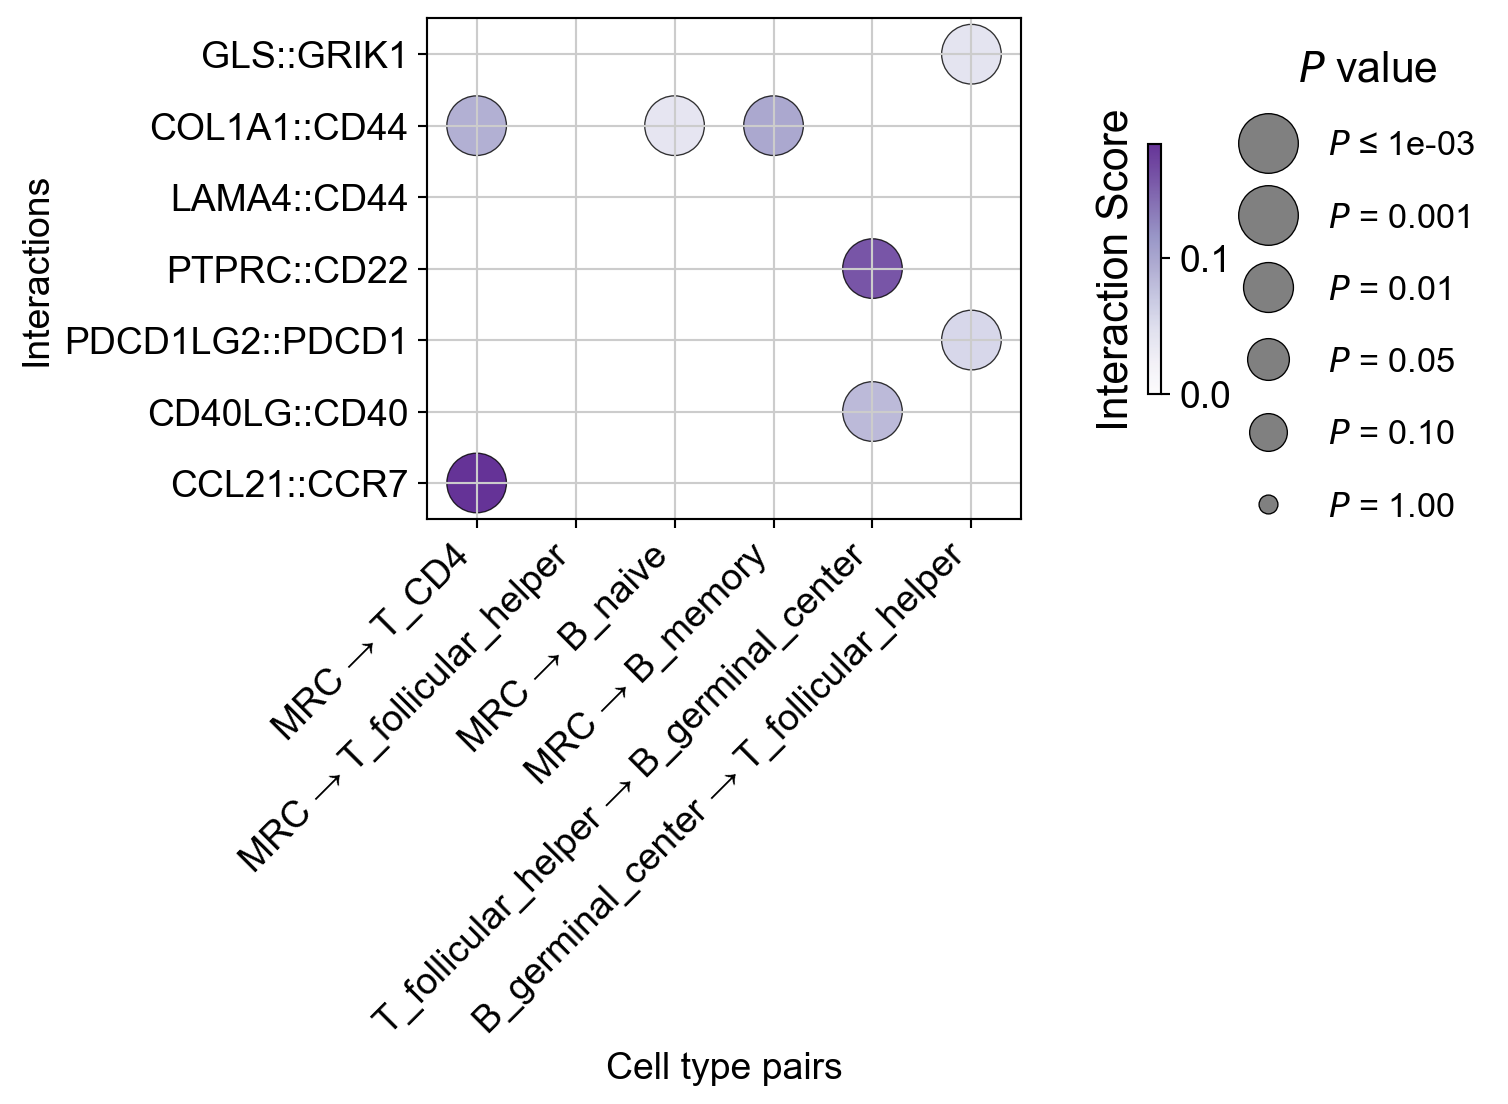
Adjust the show_grid = True parameter:
[49]:
la.pl.plotCCCDotPlot(
    res_LARIS,
    interactions_to_plot=['CCL21::CCR7', "CD40LG::CD40",  "PDCD1LG2::PDCD1", "PTPRC::CD22", "LAMA4::CD44",
                        "COL1A1::CD44",
                        "GLS::GRIK1"],
    senders=["MRC", "MRC", "MRC", "MRC", "T_follicular_helper", "B_germinal_center"],
    receivers=["T_CD4", "T_follicular_helper", "B_naive", "B_memory",  "B_germinal_center",'T_follicular_helper'],


    bubble_size=500,
    cmap='Purples',
    # filter_significant=False,
    # n_top=3000,
    filter_significant=True,
    p_value_col='p_value_fdr',
    threshold=0.05,
    filter_by_interaction_score=True,
    threshold_interaction_score=0.01,
    figsize=[8,6],
    show_grid=True,
)
[50]:
res_LARIS.head(30)
[50]:
| sender | receiver | interaction_score | ligand | receptor | interaction_name | p_value | p_value_fdr | nlog10_p_value_fdr | |
|---|---|---|---|---|---|---|---|---|---|
| 0 | B_naive | B_naive | 0.900057 | FCER2 | CR2 | FCER2::CR2 | 0.000999 | 0.010570 | 1.975922 |
| 1 | B_memory | B_memory | 0.538235 | COL4A3 | CD44 | COL4A3::CD44 | 0.000999 | 0.012469 | 1.904168 |
| 2 | B_germinal_center | B_germinal_center | 0.397066 | SEMA4A | PLXNB2 | SEMA4A::PLXNB2 | 0.000999 | 0.014026 | 1.853067 |
| 3 | T_double_neg | NK | 0.344916 | CLEC2D | KLRB1 | CLEC2D::KLRB1 | 0.000999 | 0.009419 | 2.025989 |
| 4 | B_memory | B_naive | 0.337151 | COL4A3 | CD44 | COL4A3::CD44 | 0.000999 | 0.012947 | 1.887830 |
| 5 | B_memory | B_memory | 0.324935 | COL4A4 | CD44 | COL4A4::CD44 | 0.000999 | 0.012469 | 1.904168 |
| 6 | B_memory | B_memory | 0.282586 | SEMA7A | PLXNC1 | SEMA7A::PLXNC1 | 0.000999 | 0.012469 | 1.904168 |
| 7 | pDC | B_naive | 0.276228 | APP | CD74 | APP::CD74 | 0.000999 | 0.009686 | 2.013857 |
| 8 | B_naive | B_naive | 0.258380 | APP | CD74 | APP::CD74 | 0.033966 | 0.270686 | 0.567535 |
| 9 | B_memory | B_naive | 0.244977 | APP | CD74 | APP::CD74 | 0.026973 | 0.292850 | 0.533355 |
| 10 | B_memory | T_CD8 | 0.237543 | COL4A3 | CD44 | COL4A3::CD44 | 0.000999 | 0.012488 | 1.903524 |
| 11 | B_germinal_center | B_germinal_center | 0.212287 | PTPRC | CD22 | PTPRC::CD22 | 0.000999 | 0.014026 | 1.853067 |
| 12 | B_germinal_center | B_germinal_center | 0.208078 | MIF | CD74 | MIF::CD74 | 0.000999 | 0.014026 | 1.853067 |
| 13 | B_memory | B_germinal_center | 0.199604 | PTPRC | CD22 | PTPRC::CD22 | 0.000999 | 0.013986 | 1.854306 |
| 14 | B_naive | B_memory | 0.194665 | FCER2 | CR2 | FCER2::CR2 | 0.000999 | 0.013387 | 1.873330 |
| 15 | B_naive | B_memory | 0.192835 | COL4A3 | CD44 | COL4A3::CD44 | 0.028971 | 0.286856 | 0.542336 |
| 16 | plasma | plasma | 0.186626 | WNT5B | FZD6 | WNT5B::FZD6 | 0.000999 | 0.010347 | 1.985195 |
| 17 | MRC | T_CD4 | 0.184022 | CCL21 | CCR7 | CCL21::CCR7 | 0.000999 | 0.016983 | 1.769986 |
| 18 | pDC | B_memory | 0.179336 | APP | CD74 | APP::CD74 | 0.000999 | 0.009078 | 2.042016 |
| 19 | T_double_neg | B_germinal_center | 0.178474 | PECAM1 | CD38 | PECAM1::CD38 | 0.000999 | 0.008242 | 2.083981 |
| 20 | B_naive | B_naive | 0.177099 | PTPRC | CD22 | PTPRC::CD22 | 0.070929 | 0.323121 | 0.490635 |
| 21 | B_germinal_center | B_naive | 0.170844 | MIF | CD74 | MIF::CD74 | 0.000999 | 0.012367 | 1.907738 |
| 22 | B_naive | B_memory | 0.167823 | APP | CD74 | APP::CD74 | 0.063936 | 0.368617 | 0.433425 |
| 23 | plasma | plasma | 0.165556 | PECAM1 | CD38 | PECAM1::CD38 | 0.000999 | 0.010347 | 1.985195 |
| 24 | B_memory | B_naive | 0.162031 | PTPRC | CD22 | PTPRC::CD22 | 0.067932 | 0.343595 | 0.463954 |
| 25 | B_naive | B_memory | 0.159976 | TGFB1 | TGFBR2 | TGFB1::TGFBR2 | 0.067932 | 0.368617 | 0.433425 |
| 26 | T_follicular_helper | B_germinal_center | 0.158691 | PTPRC | CD22 | PTPRC::CD22 | 0.000999 | 0.010323 | 1.986194 |
| 27 | B_naive | B_naive | 0.158079 | TGFB1 | TGFBR2 | TGFB1::TGFBR2 | 0.023976 | 0.245754 | 0.609499 |
| 28 | B_memory | B_memory | 0.154764 | APP | CD74 | APP::CD74 | 0.101898 | 0.397187 | 0.401005 |
| 29 | B_naive | B_memory | 0.151714 | ANGPTL1 | ITGB1 | ANGPTL1::ITGB1 | 0.064935 | 0.368617 | 0.433425 |
[51]:
res_LARIS[res_LARIS['sender']=='FDC_LZDZ']
[51]:
| sender | receiver | interaction_score | ligand | receptor | interaction_name | p_value | p_value_fdr | nlog10_p_value_fdr | |
|---|---|---|---|---|---|---|---|---|---|
| 109 | FDC_LZDZ | B_memory | 0.054153 | FN1 | ITGA4 | FN1::ITGA4 | 0.000999 | 0.013291 | 1.876441 |
| 124 | FDC_LZDZ | B_memory | 0.046145 | FN1 | CD44 | FN1::CD44 | 0.000999 | 0.013291 | 1.876441 |
| 135 | FDC_LZDZ | mDC | 0.043458 | FN1 | ITGA4 | FN1::ITGA4 | 0.000999 | 0.007473 | 2.126533 |
| 149 | FDC_LZDZ | FDC_LZDZ | 0.039254 | SLC1A2 | GRIA3 | SLC1A2::GRIA3 | 0.000999 | 0.012916 | 1.888884 |
| 151 | FDC_LZDZ | T_CD8 | 0.038067 | FN1 | CD44 | FN1::CD44 | 0.000999 | 0.011748 | 1.930027 |
| ... | ... | ... | ... | ... | ... | ... | ... | ... | ... |
| 389053 | FDC_LZDZ | FDC_LZDZ | 0.000000 | NRG2 | ERBB4 | NRG2::ERBB4 | 1.000000 | 1.000000 | 0.000000 |
| 389054 | FDC_LZDZ | FDC_LZDZ | 0.000000 | LAMC2 | ITGB4 | LAMC2::ITGB4 | 1.000000 | 1.000000 | 0.000000 |
| 389055 | FDC_LZDZ | FDC_LZDZ | 0.000000 | NRG1 | ITGB4 | NRG1::ITGB4 | 1.000000 | 1.000000 | 0.000000 |
| 389056 | FDC_LZDZ | FDC_LZDZ | 0.000000 | NRG3 | ERBB4 | NRG3::ERBB4 | 1.000000 | 1.000000 | 0.000000 |
| 389057 | FDC_LZDZ | FDC_LZDZ | 0.000000 | LAMA3 | ITGB4 | LAMA3::ITGB4 | 1.000000 | 1.000000 | 0.000000 |
27790 rows × 9 columns
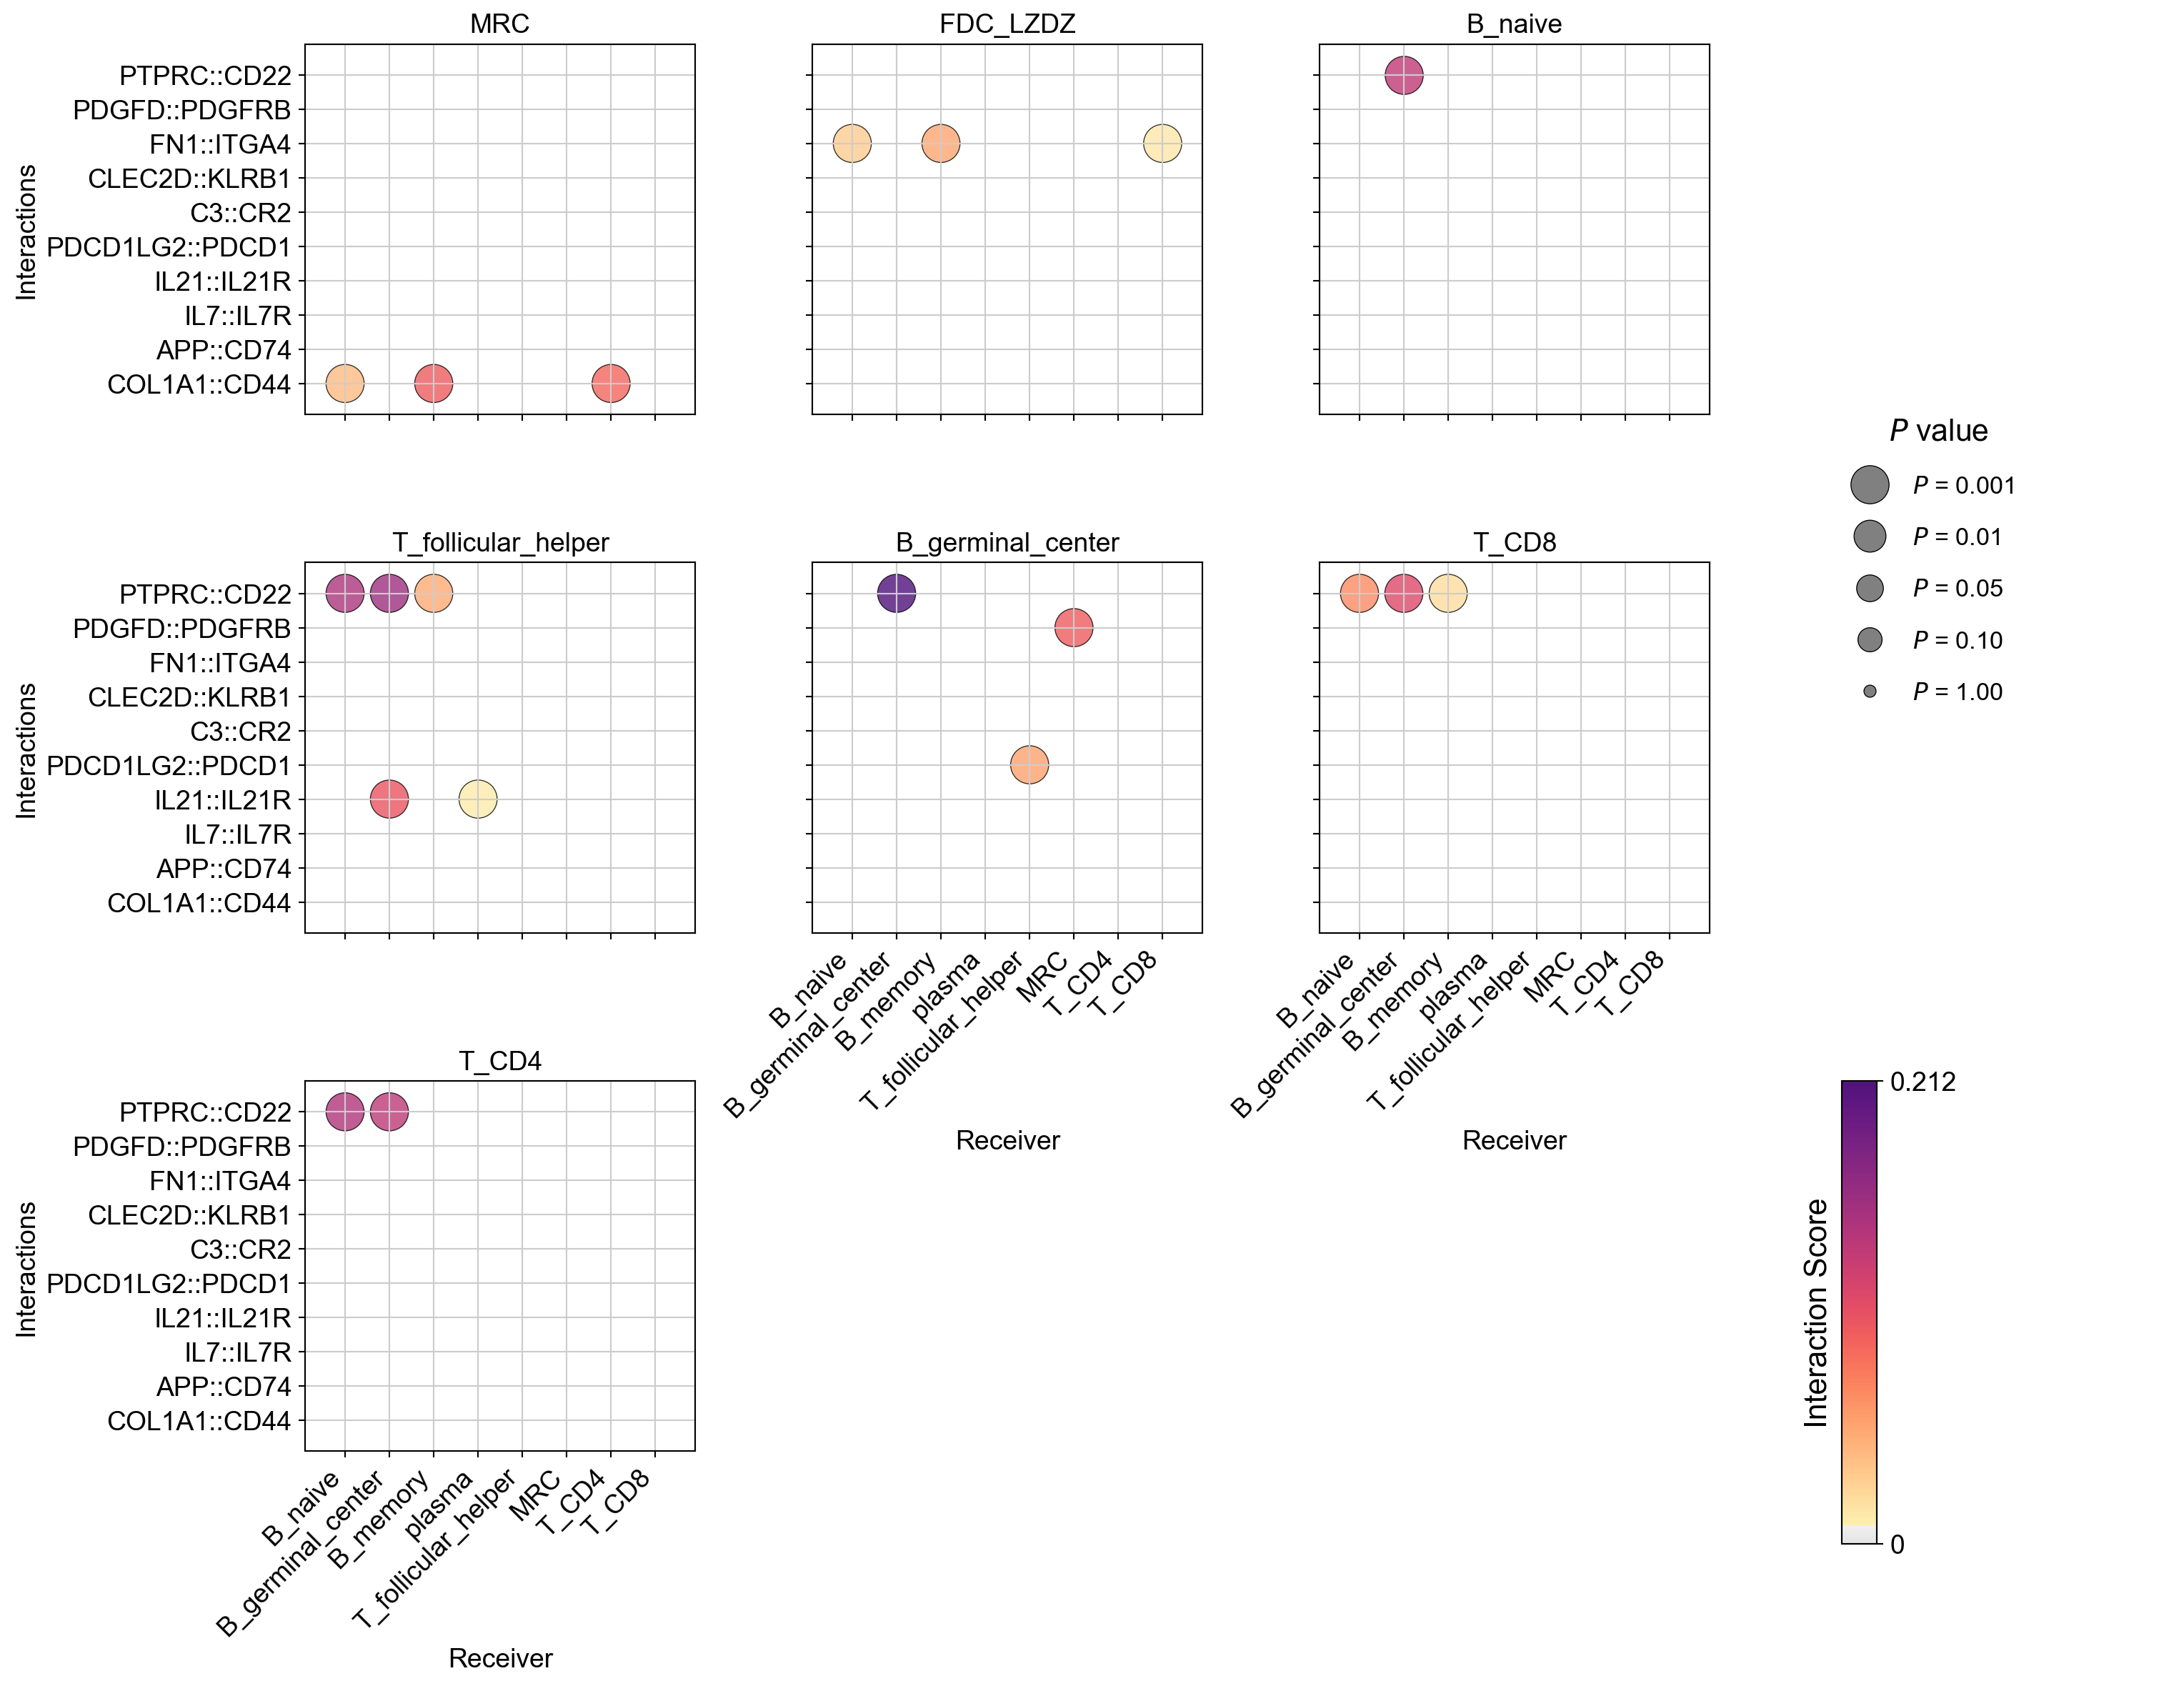
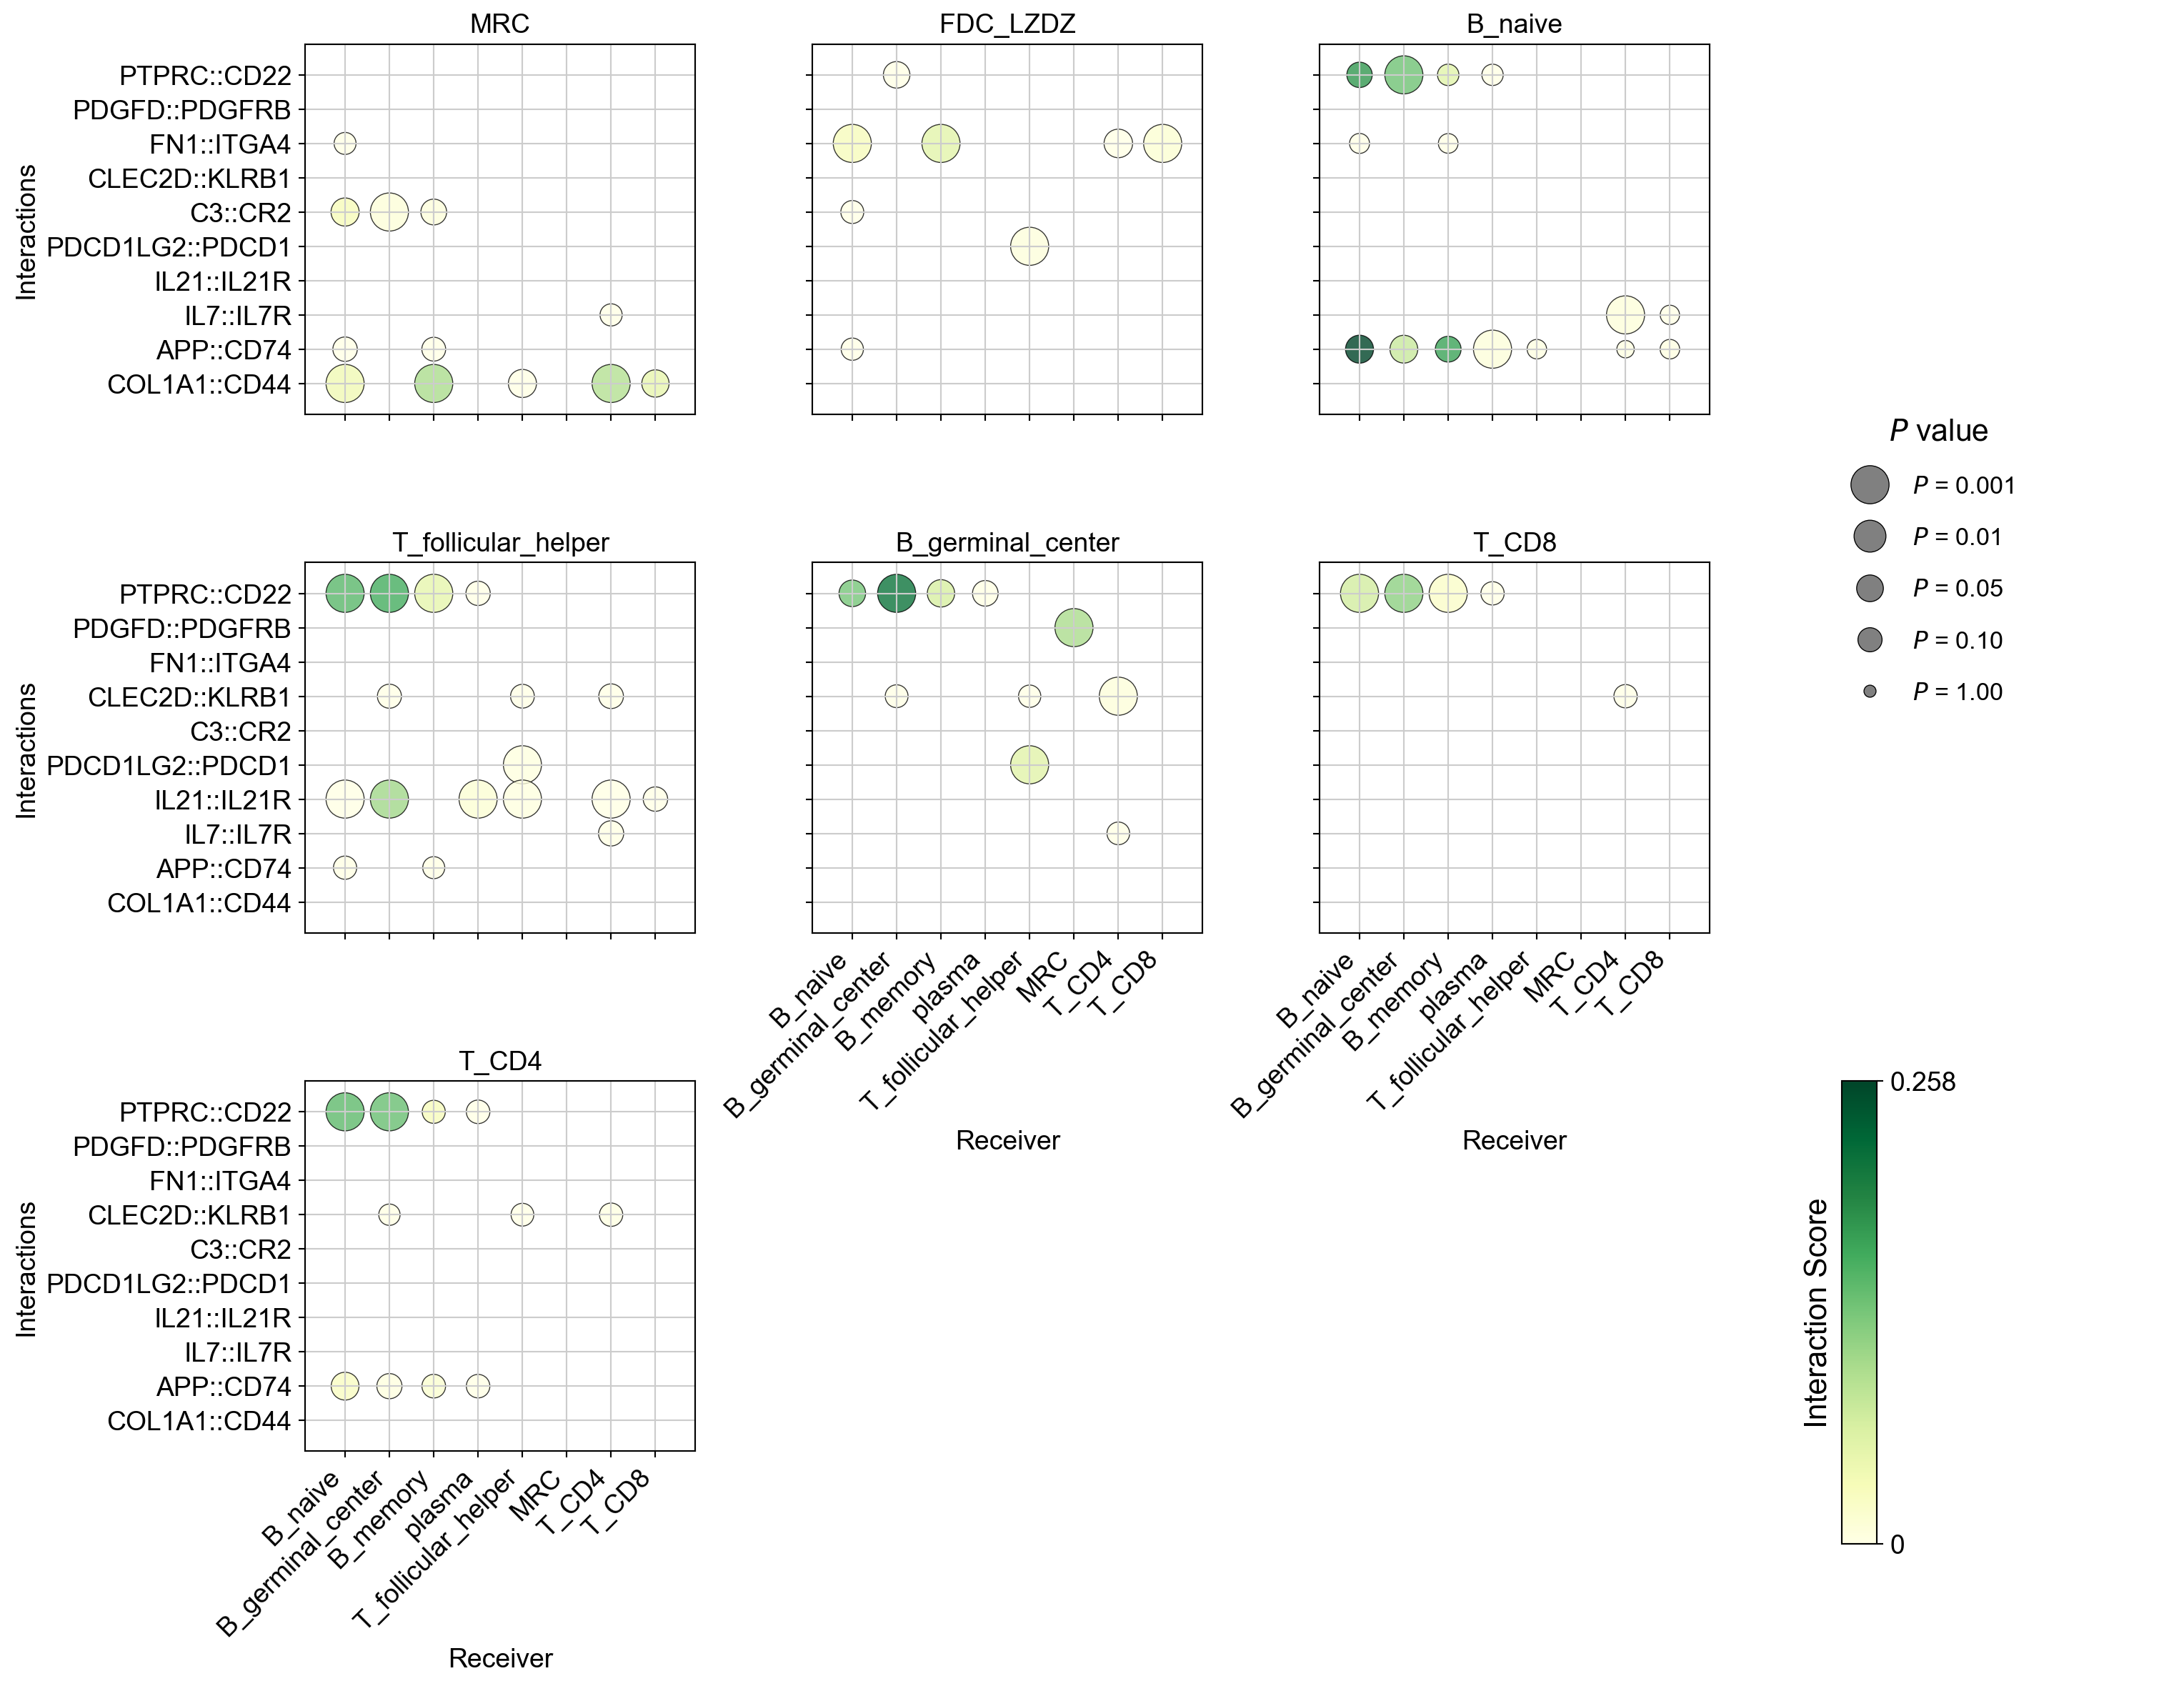
CCC DotPlot (Facet)#
[52]:
la.pl.plotCCCDotPlotFacet(
    res_LARIS,
    senders=["MRC", "FDC_LZDZ", "B_naive", 'T_follicular_helper','B_germinal_center', 'T_CD8', 'T_CD4'],
    receivers=[
        "B_naive",
        "B_germinal_center",
        "B_memory",
        "plasma",
        'T_follicular_helper',
        'MRC',
        'T_CD4',
        'T_CD8'

    ],
    interactions_to_plot=[
        "COL1A1::CD44",
        'APP::CD74',
        "IL7::IL7R",
        "IL21::IL21R",
        'PDCD1LG2::PDCD1',
        "C3::CR2",  "CLEC2D::KLRB1",
        'FN1::ITGA4',
        'PDGFD::PDGFRB','PTPRC::CD22', ],
)
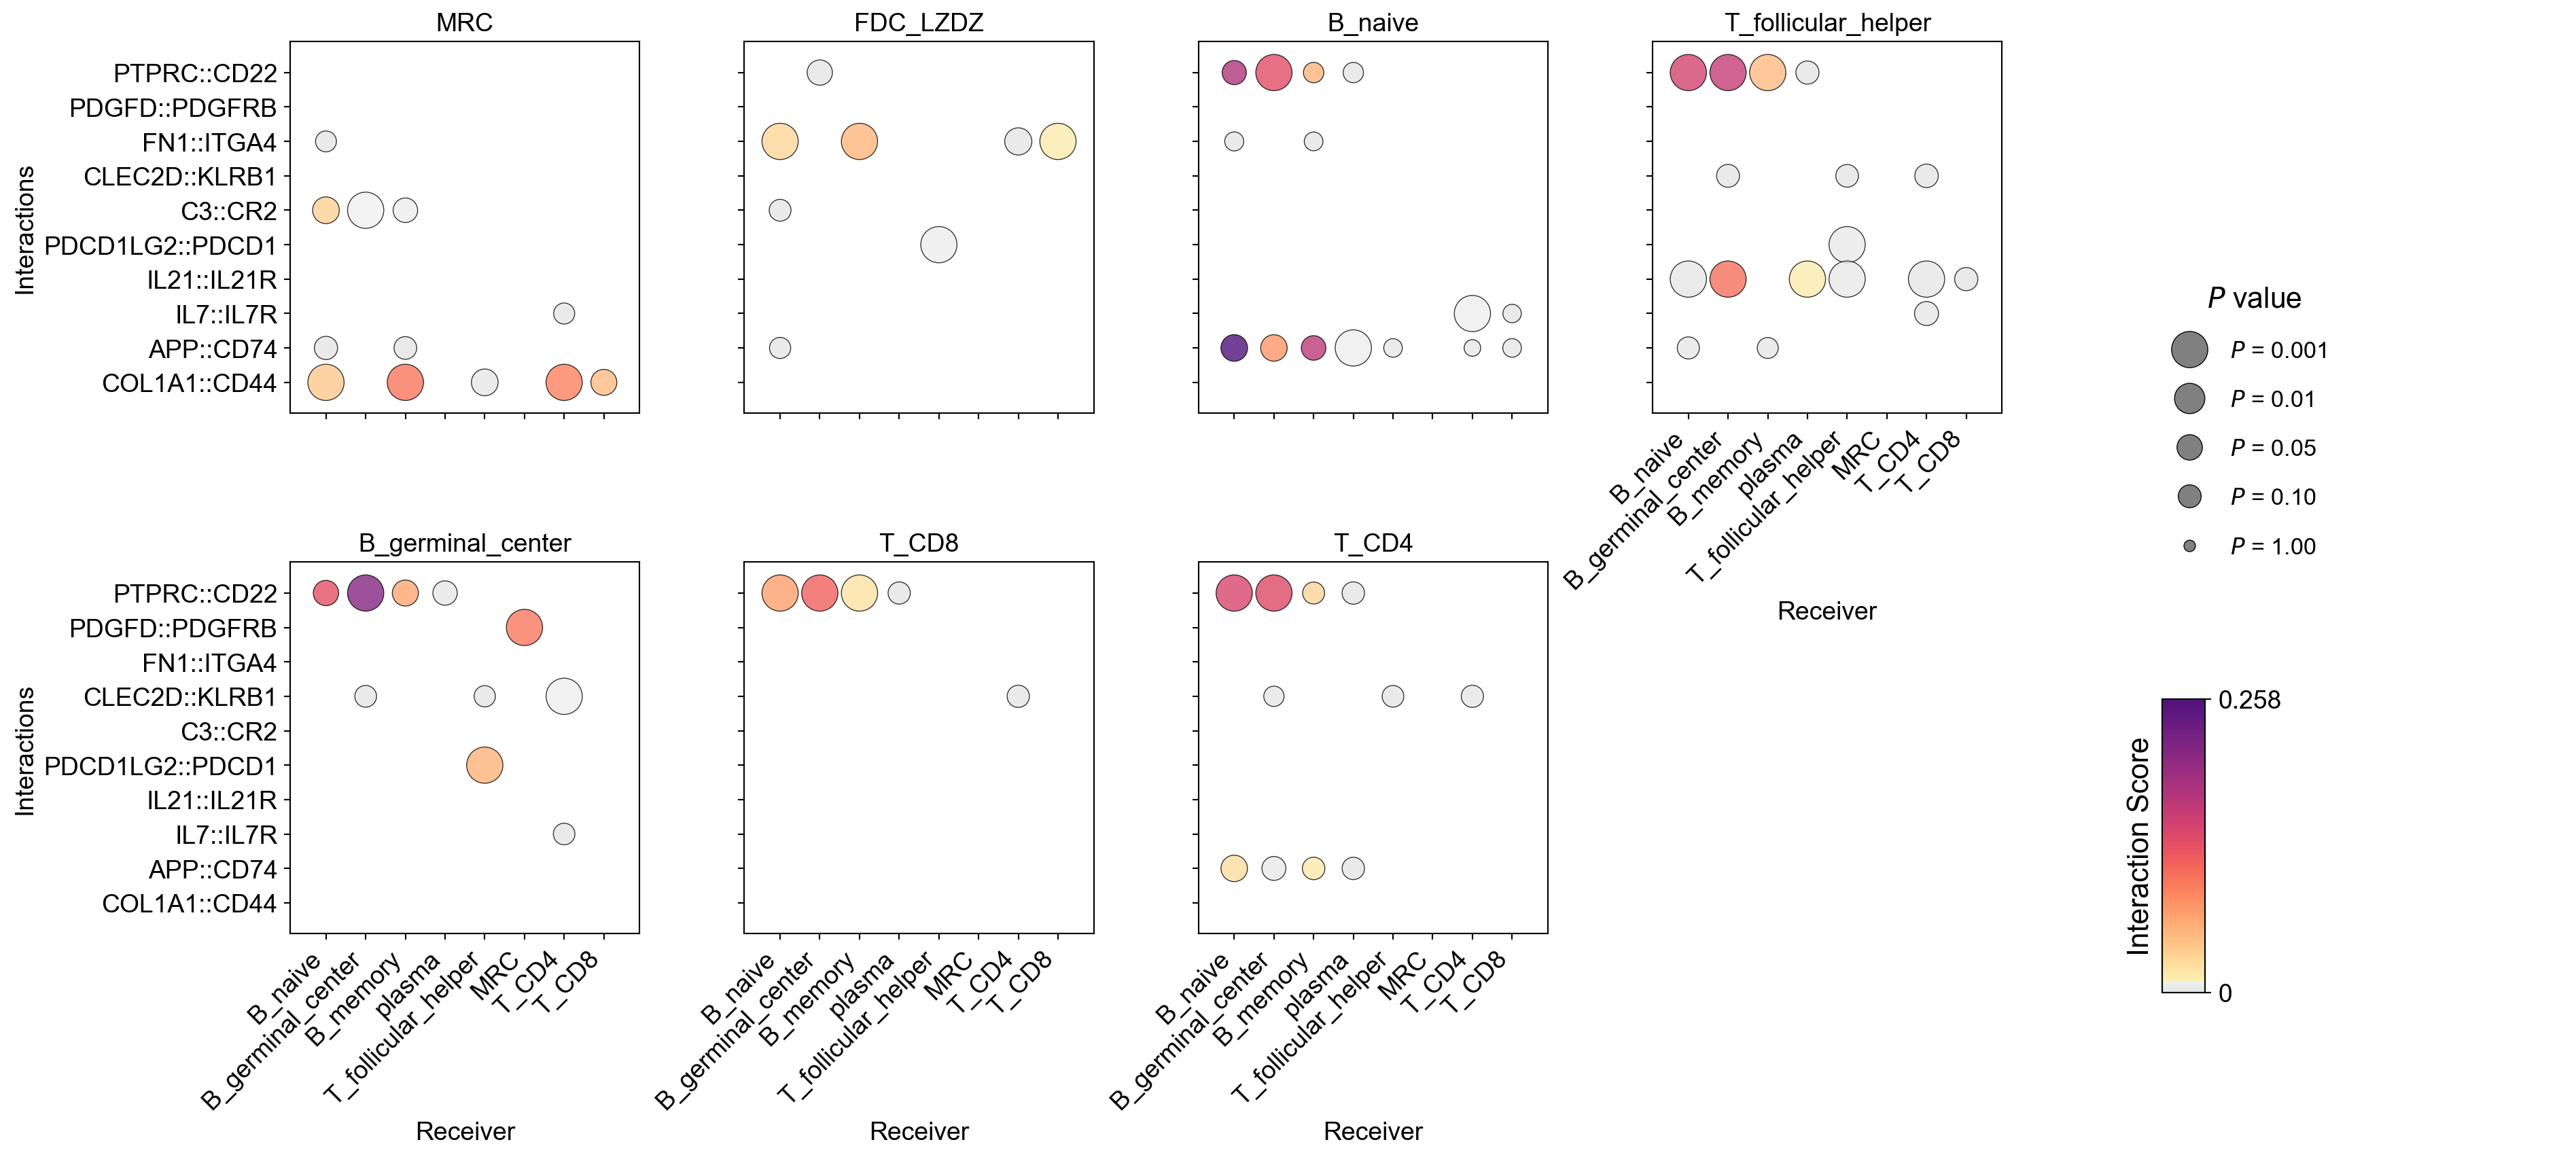
Use top ones, no filtering on P values or scores:
[53]:
la.pl.plotCCCDotPlotFacet(
    res_LARIS,
    senders=["MRC", "FDC_LZDZ", "B_naive", 'T_follicular_helper','B_germinal_center', 'T_CD8', 'T_CD4'],
    receivers=[
        "B_naive",
        "B_germinal_center",
        "B_memory",
        "plasma",
        'T_follicular_helper',
        'MRC',
        'T_CD4',
        'T_CD8'

    ],
    interactions_to_plot=[
        "COL1A1::CD44",
        'APP::CD74',
        "IL7::IL7R",
        "IL21::IL21R",
        'PDCD1LG2::PDCD1',
        "C3::CR2",  "CLEC2D::KLRB1",
        'FN1::ITGA4',
        'PDGFD::PDGFRB','PTPRC::CD22', ],

    cmap='YlGn',

    filter_significant=False, filter_by_interaction_score=False, n_top=3000,

    # filter_significant=True, filter_by_interaction_score=True,
    p_value_col='p_value',
    threshold=0.05,
    threshold_interaction_score=0.01,
    # ncol=6,
)
No filters applied. Using top 3000 interactions.
Change the ncol to control the number of columns, and also turn off the grid lines by show_grid = False:
[54]:
la.pl.plotCCCDotPlotFacet(
    res_LARIS,
    senders=["MRC", "FDC_LZDZ", "B_naive", 'T_follicular_helper','B_germinal_center', 'T_CD8', 'T_CD4'],
    receivers=[
        "B_naive",
        "B_germinal_center",
        "B_memory",
        "plasma",
        'T_follicular_helper',
        'MRC',
        'T_CD4',
        'T_CD8'

    ],
    interactions_to_plot=[
        "COL1A1::CD44",
        'APP::CD74',
        "IL7::IL7R",
        "IL21::IL21R",
        'PDCD1LG2::PDCD1',
        "C3::CR2",  "CLEC2D::KLRB1",
        'FN1::ITGA4',
        'PDGFD::PDGFRB','PTPRC::CD22', ],


    cmap=pos_cmap,

    filter_significant=False, filter_by_interaction_score=False, n_top=3000,

    # filter_significant=True, filter_by_interaction_score=True,
    p_value_col='p_value',
    threshold=0.05,
    threshold_interaction_score=0.01,
    ncol=4,
    show_grid = False
)
No filters applied. Using top 3000 interactions.
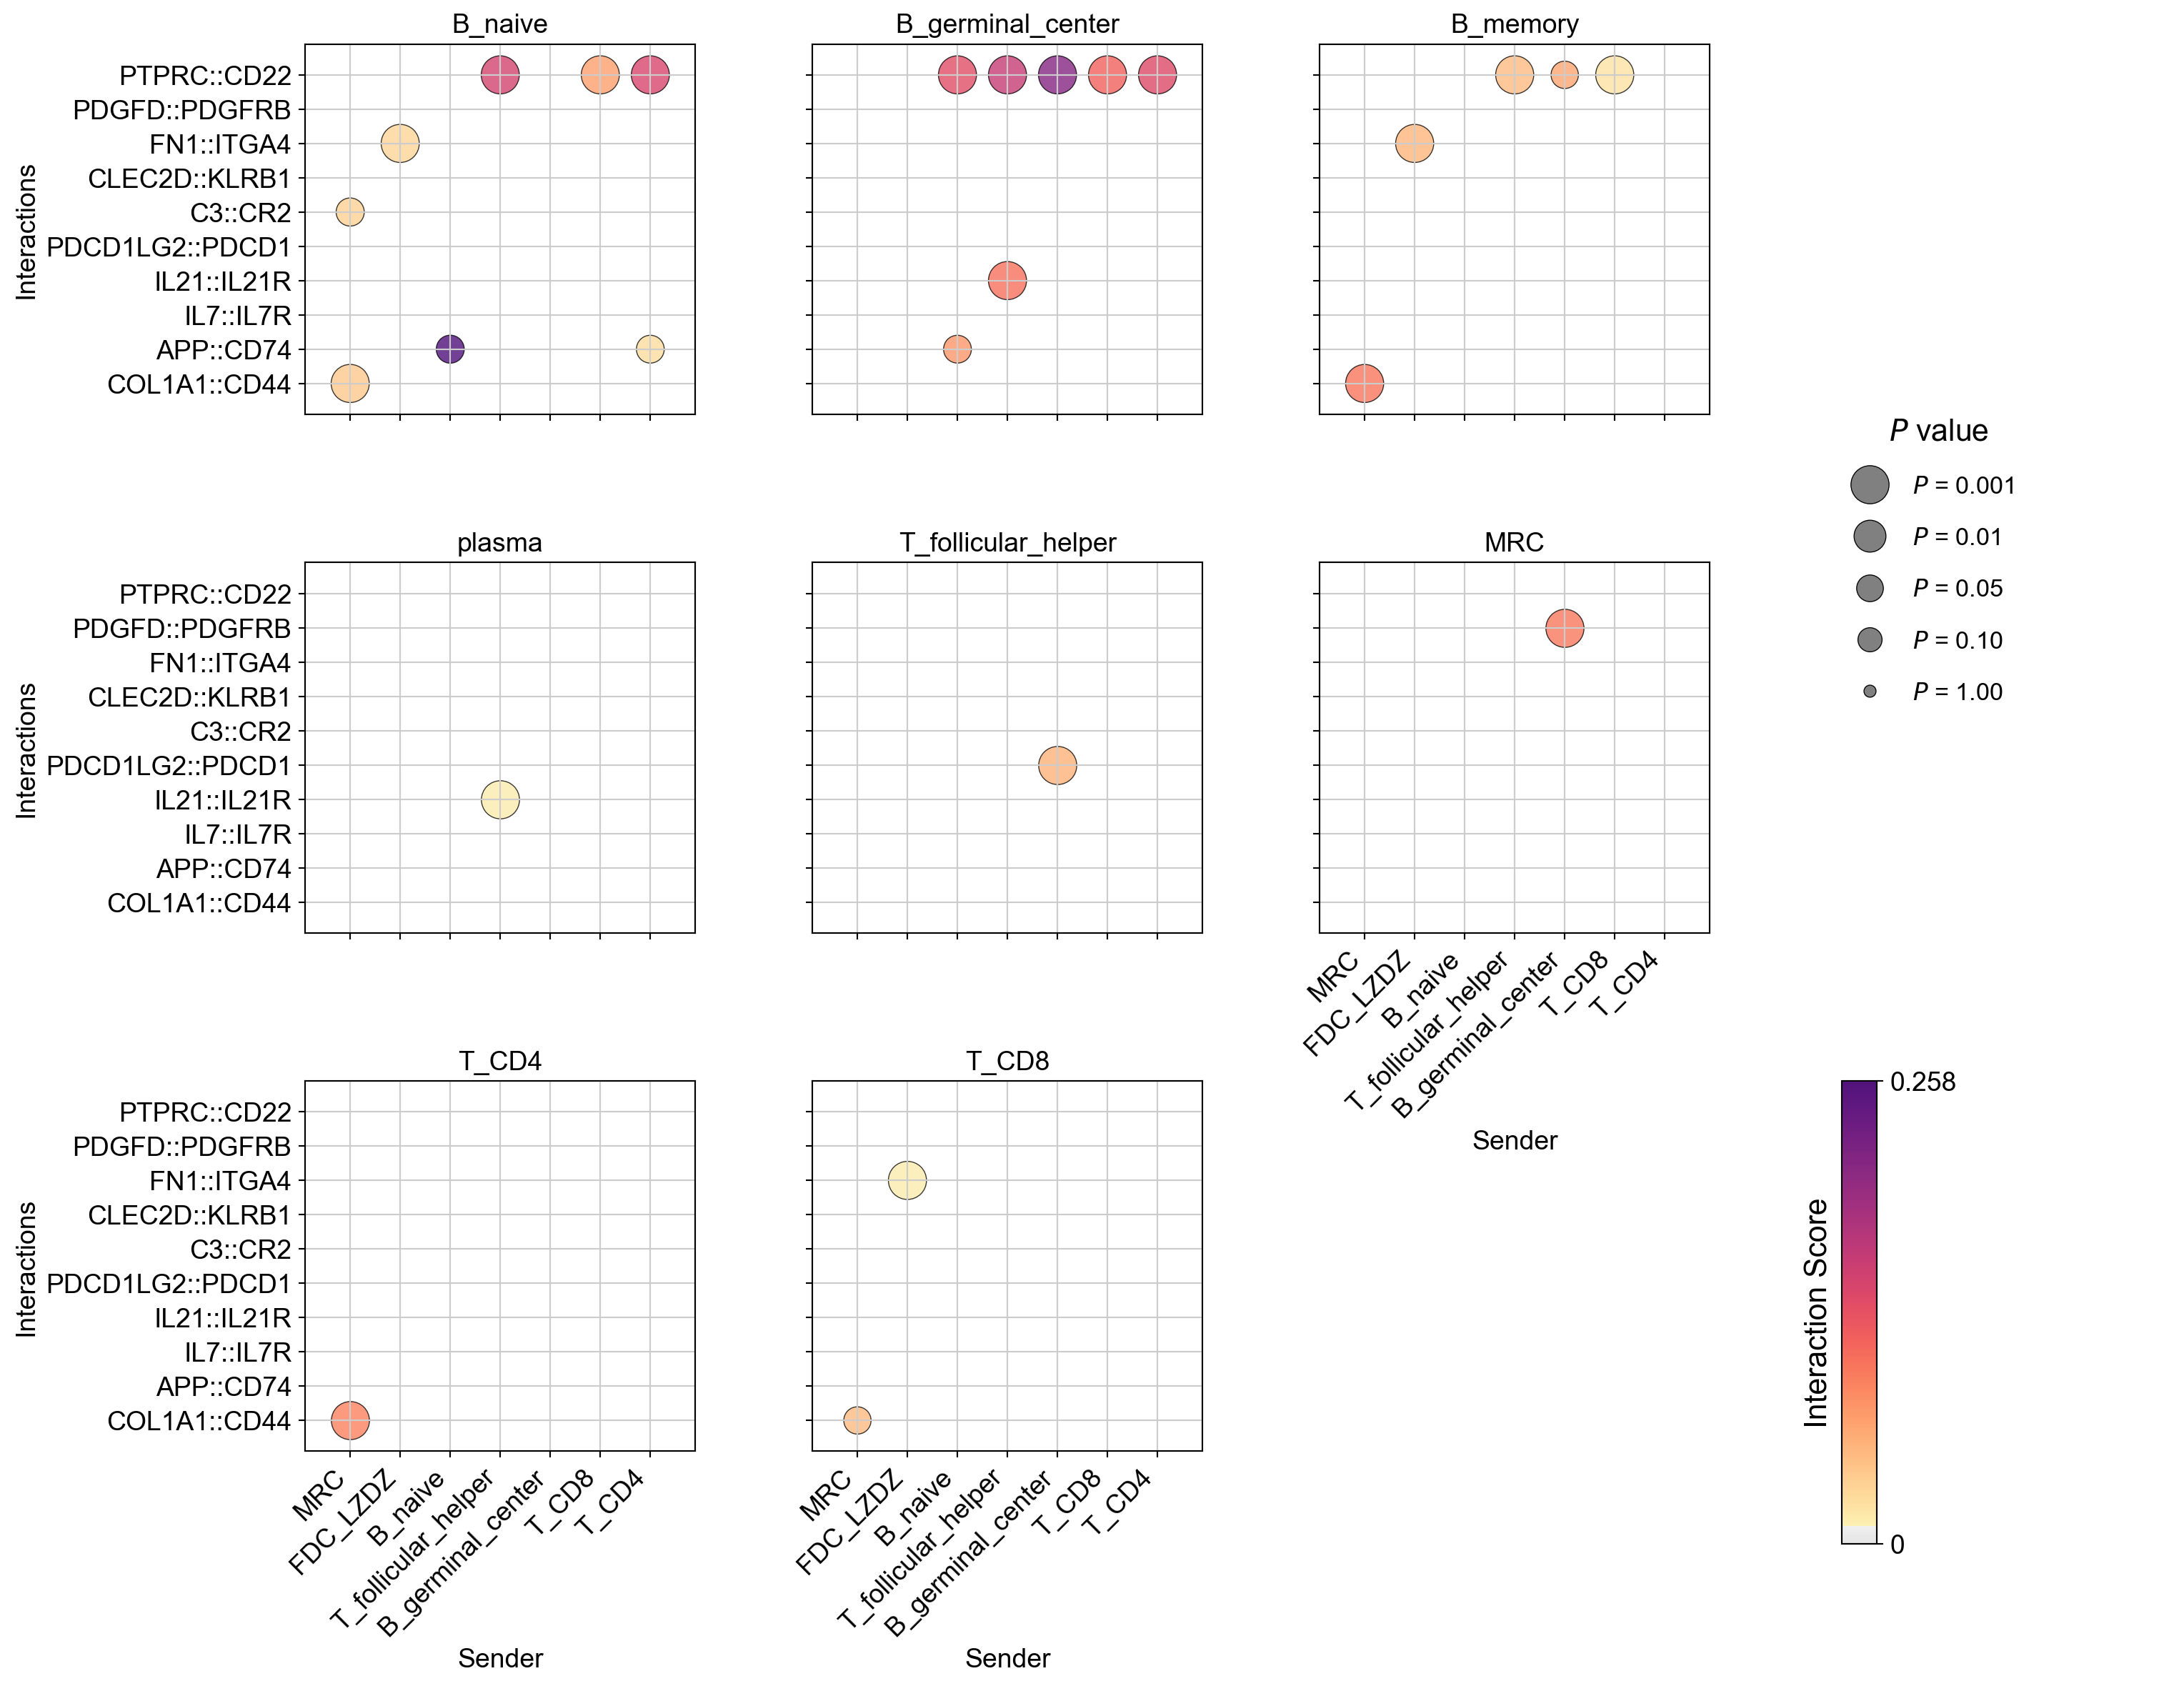
CCC DotPlot (Facet), facet by receiver#
[55]:
la.pl.plotCCCDotPlotFacet(
    res_LARIS,
    facet_by='receiver',
    senders=["MRC", "FDC_LZDZ", "B_naive", 'T_follicular_helper','B_germinal_center', 'T_CD8', 'T_CD4'],
    receivers=[
        "B_naive",
        "B_germinal_center",
        "B_memory",
        "plasma",
        'T_follicular_helper',
        'MRC',
        'T_CD4',
        'T_CD8'

    ],
    interactions_to_plot=[
        "COL1A1::CD44",
        'APP::CD74',
        "IL7::IL7R",
        "IL21::IL21R",
        'PDCD1LG2::PDCD1',
        "C3::CR2",  "CLEC2D::KLRB1",
        'FN1::ITGA4',
        'PDGFD::PDGFRB','PTPRC::CD22', ],


    cmap=pos_cmap,
    # filter_significant=False, n_top=3000,

    filter_significant=True,
    p_value_col='p_value',
    threshold=0.05,
    filter_by_interaction_score=True,
    threshold_interaction_score=0.01,
    ncol=3,
)
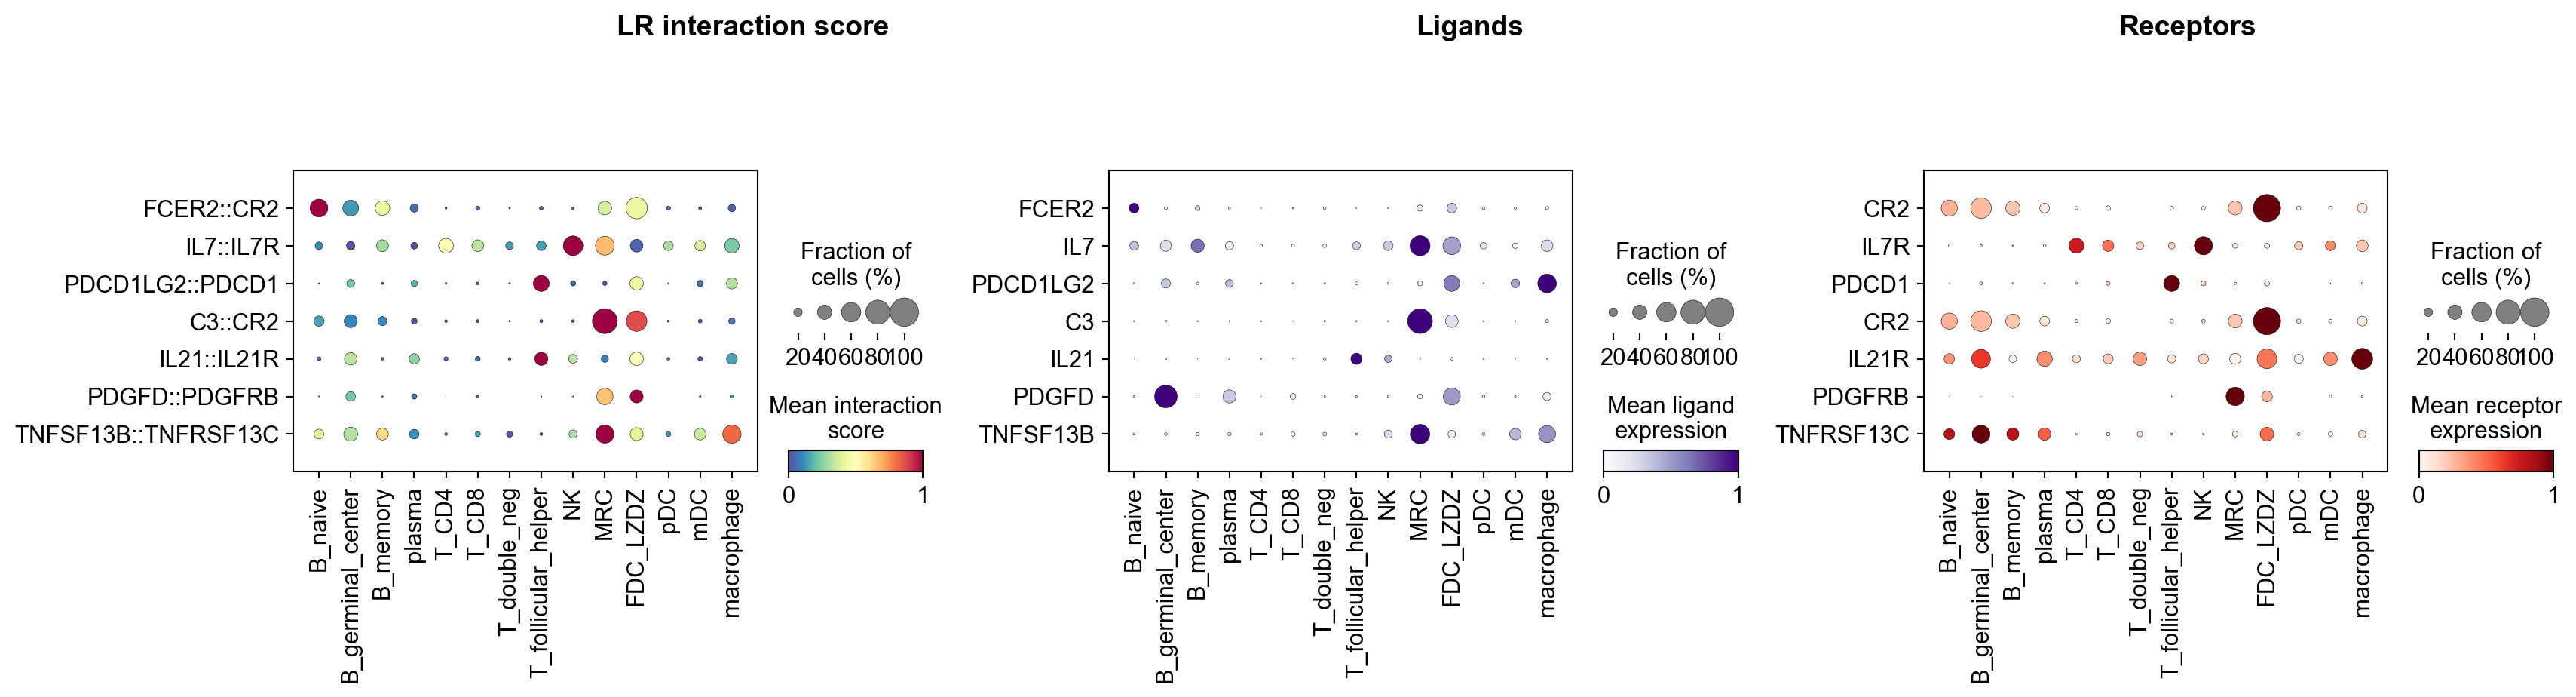
Create combined object with LR scores and gene expression combined#
[56]:
adata_dotplot = la.pl.prepareDotPlotAdata(lr_adata, adata)
Created combined AnnData: 5695 cells × 27568 features
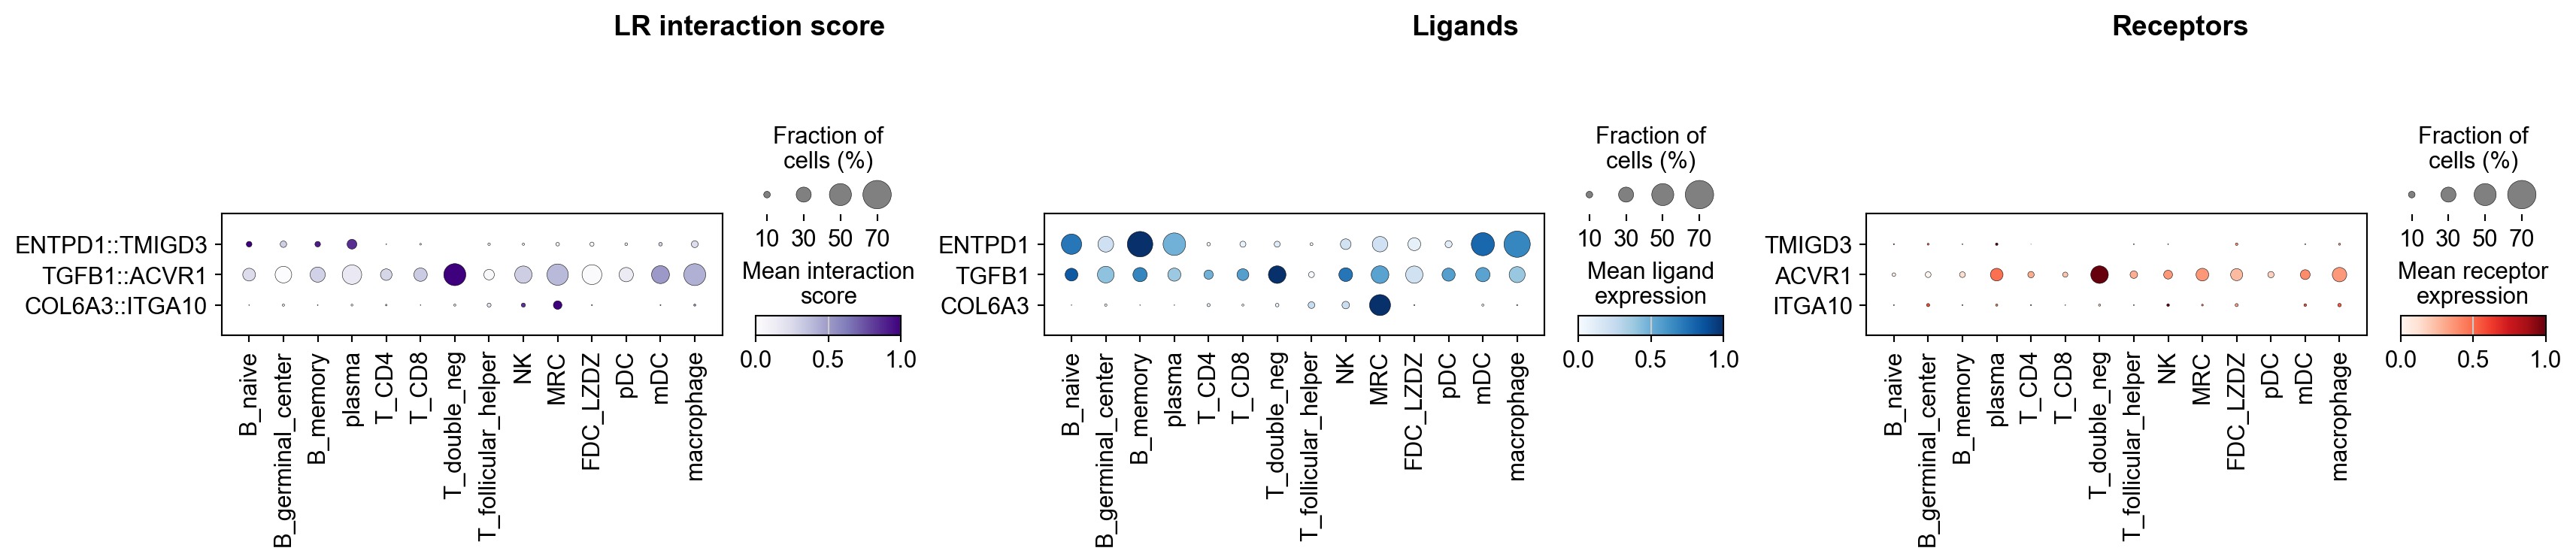
[57]:
la.pl.plotLRDotPlot(
    adata_dotplot,
    ["FCER2::CR2", "IL7::IL7R", 'PDCD1LG2::PDCD1', "C3::CR2", "IL21::IL21R",'PDGFD::PDGFRB','TNFSF13B::TNFRSF13C'],
    groupby='cell_type',
    cmap_interaction='Spectral_r',
    cmap_ligand='Purples',
    cmap_receptor='Reds',
    figsize=[18, 5],
)
[58]:
la.pl.plotLRDotPlot(
    adata_dotplot,
    ['ENTPD1::TMIGD3', 'TGFB1::ACVR1', 'COL6A3::ITGA10'],
    groupby='cell_type',
    cmap_interaction='Purples',
    cmap_ligand='Blues',
    cmap_receptor='Reds',
    figsize=[18, 4],
)
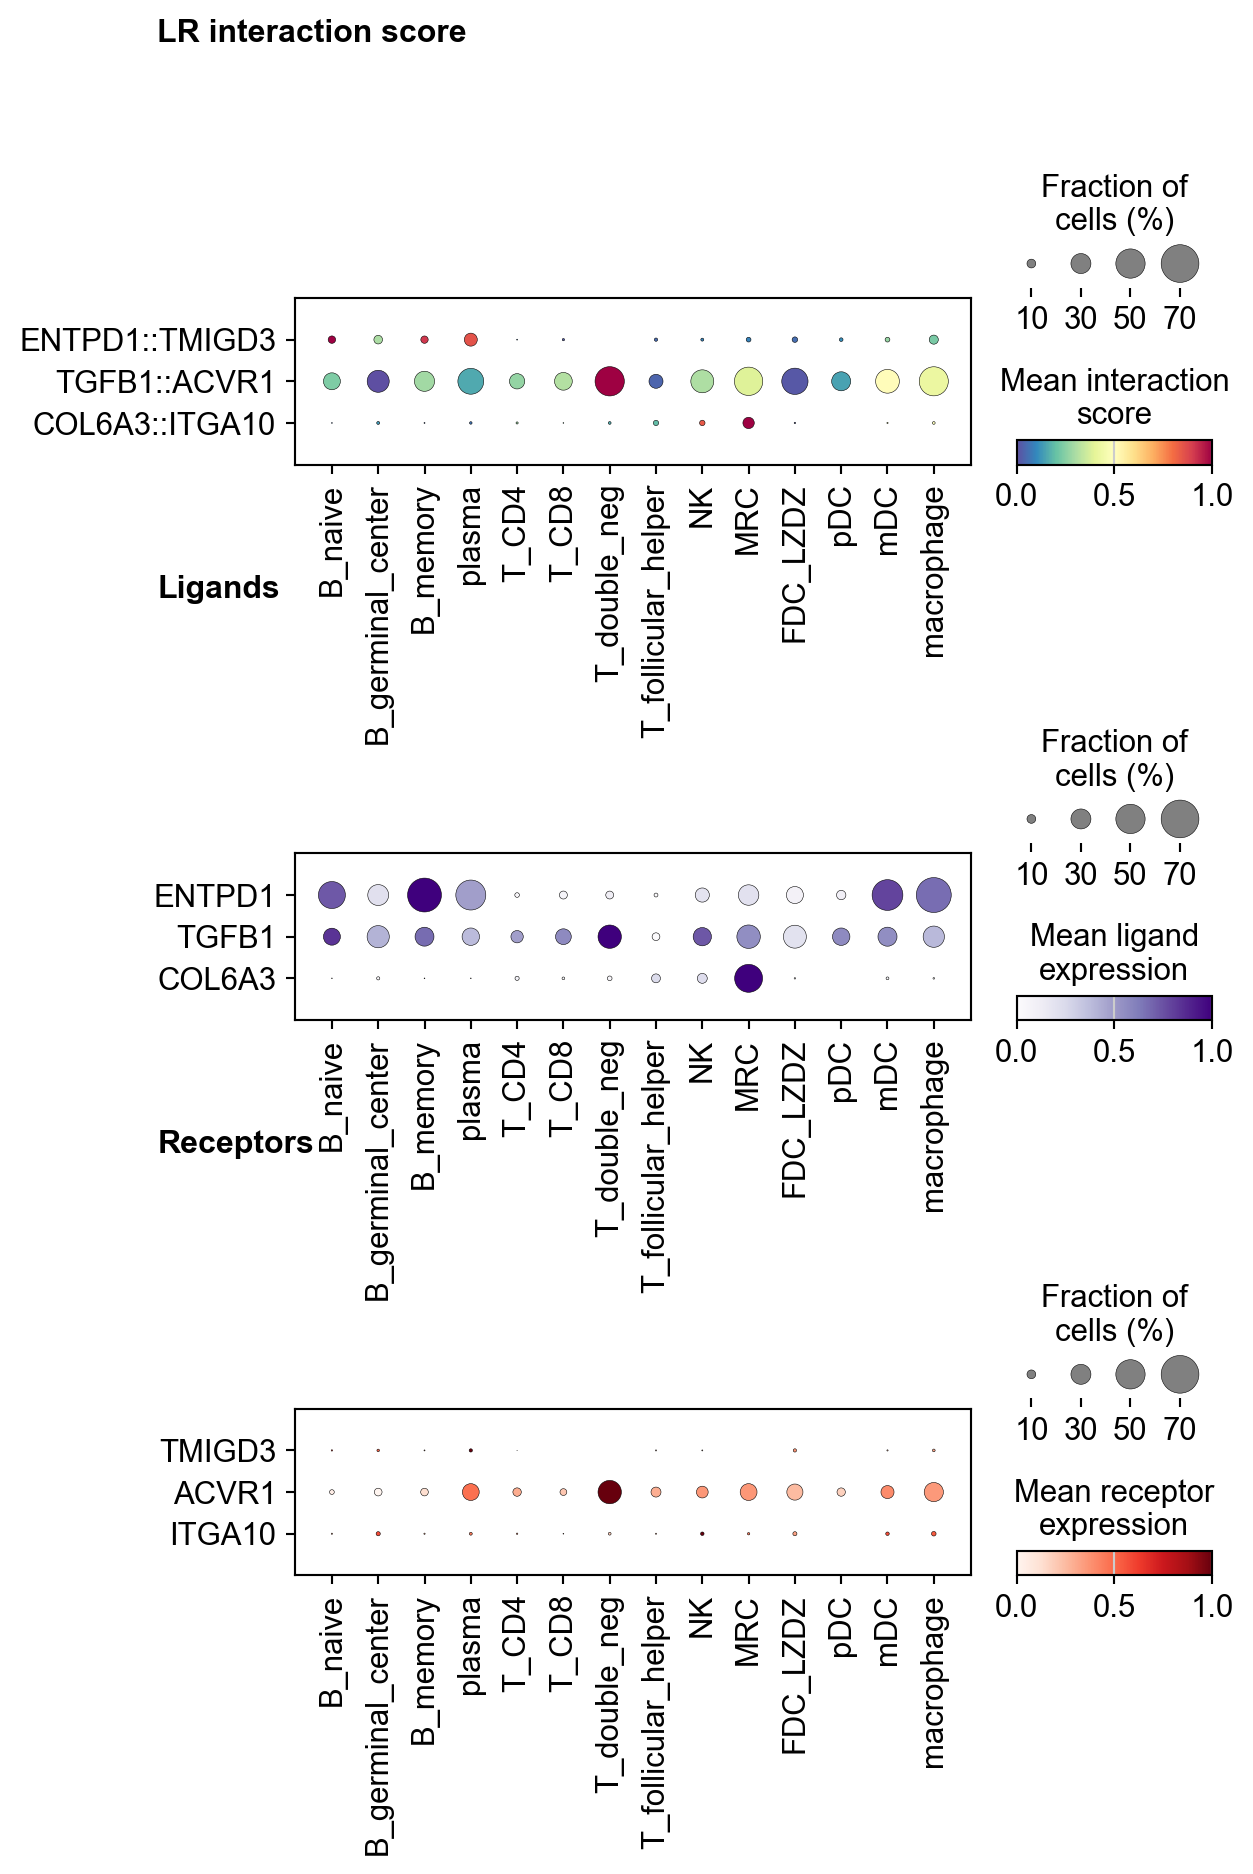
[59]:
la.pl.plotLRDotPlot(
    adata_dotplot,
    ['ENTPD1::TMIGD3', 'TGFB1::ACVR1', 'COL6A3::ITGA10'],
    groupby='cell_type',
    cmap_interaction='Spectral_r',
    cmap_ligand='Purples',
    cmap_receptor='Reds',
    figsize=[6, 10],
    orientation='vertical'
)
Spatial plot of participating cells for an interaction#
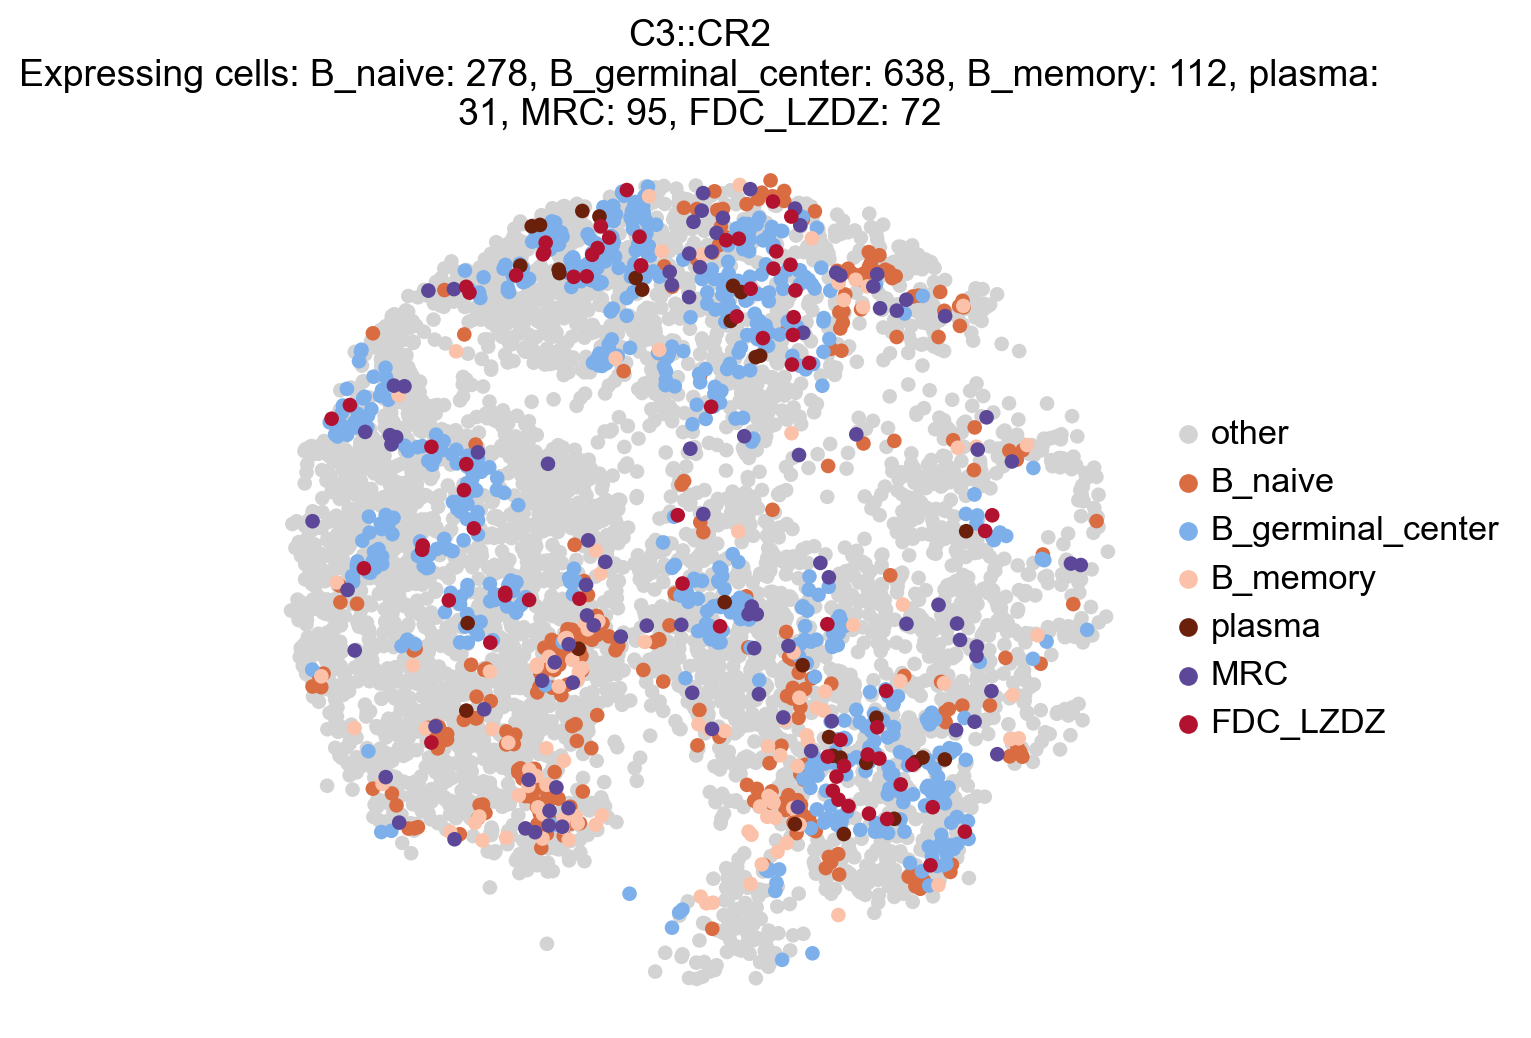
[60]:
# Plot selected cells that have an interaction score for a certain interaction ((participating in an interaction))
la.pl.plotCCCSpatial(
    lr_adata=lr_adata,
    basis="X_spatial",
    interaction='C3::CR2',
    cell_type="cell_type",
    selected_cell_types=['B_naive', 'B_germinal_center','B_memory','plasma','MRC','FDC_LZDZ'],
    background_color='lightgrey',
    colors=['#da6c42','#7db0ea','#fbc2a9','#6b200c','#5c4799','#b31130'],  # ['#d53e4f','#fdae61','#3288bd','#3288bd','#3288bd','#3288bd','#3288bd']
    size=120,
    fig_width=6,
)
Spatial plot of participating cells for an interaction, all cells#
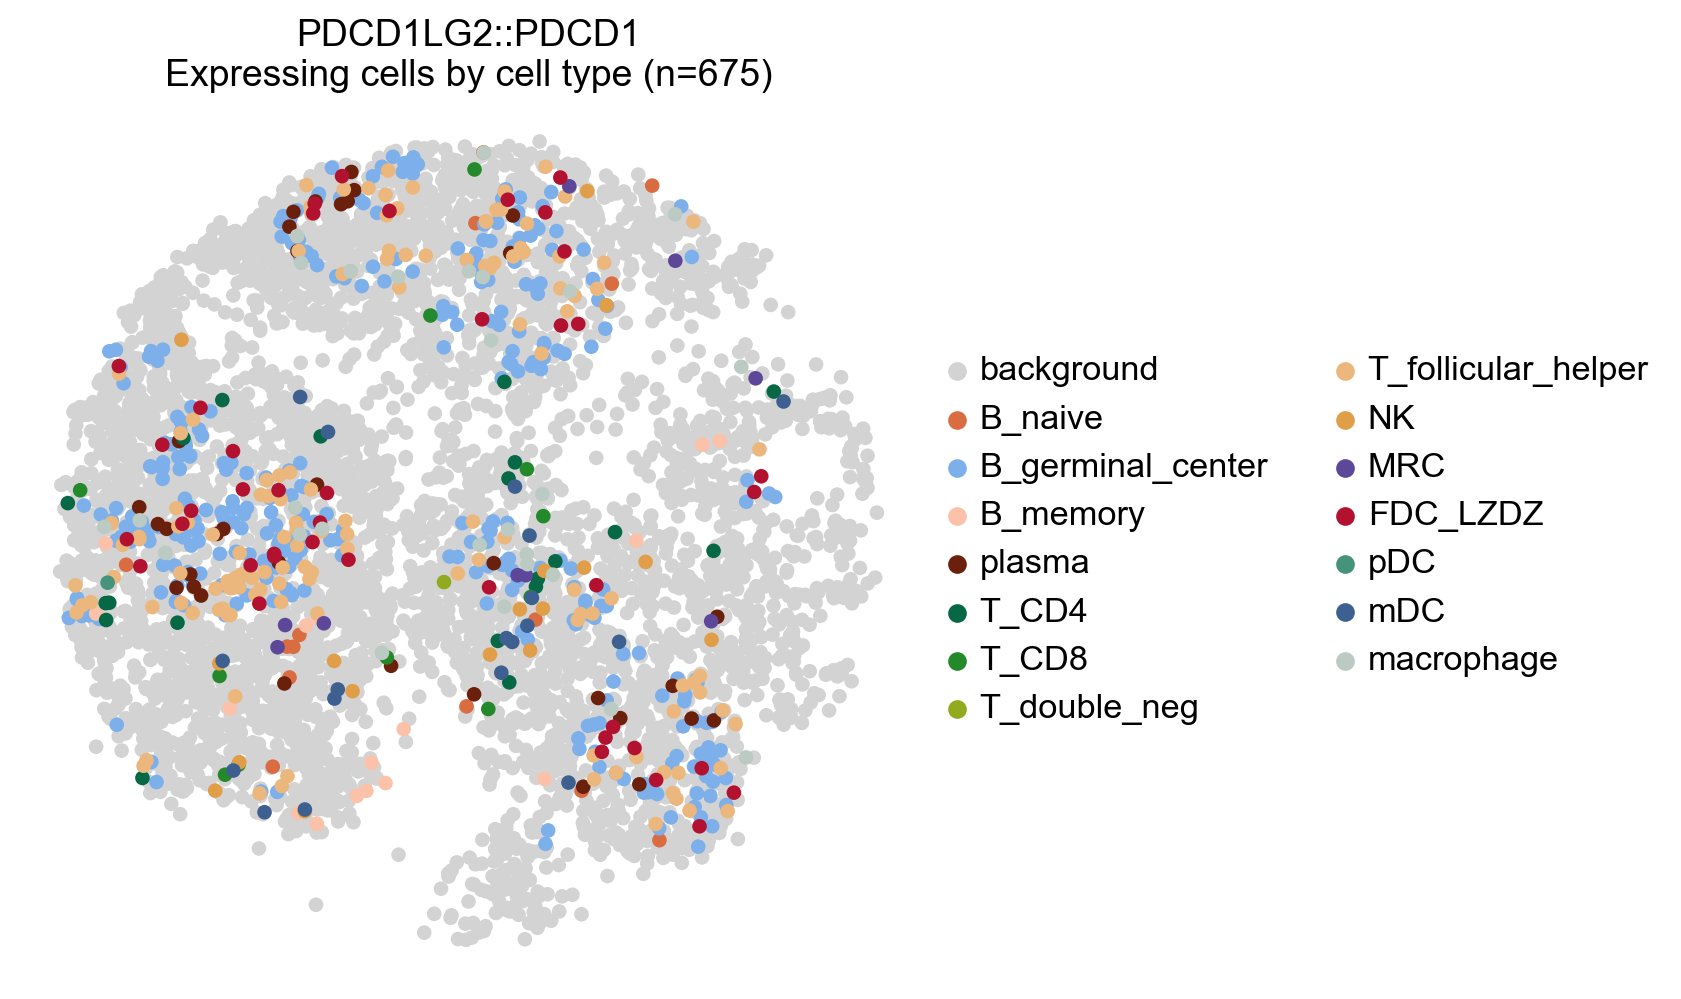
[61]:
# Plot any cell that has an interaction score for a cetrain LR pair (participating in an interaction)
lr_adata.uns['cell_type_colors'] = adata.uns['cell_type_colors'].copy()
# Highlight all expressing cells with original colors by setting `highlight_all_expressing=True`
la.pl.plotCCCSpatial(
    lr_adata,
    basis='X_spatial',
    interaction='PDCD1LG2::PDCD1',
    cell_type='cell_type',
    background_color='lightgrey',
    highlight_all_expressing=True,
    size=120,
    fig_width=6,
)
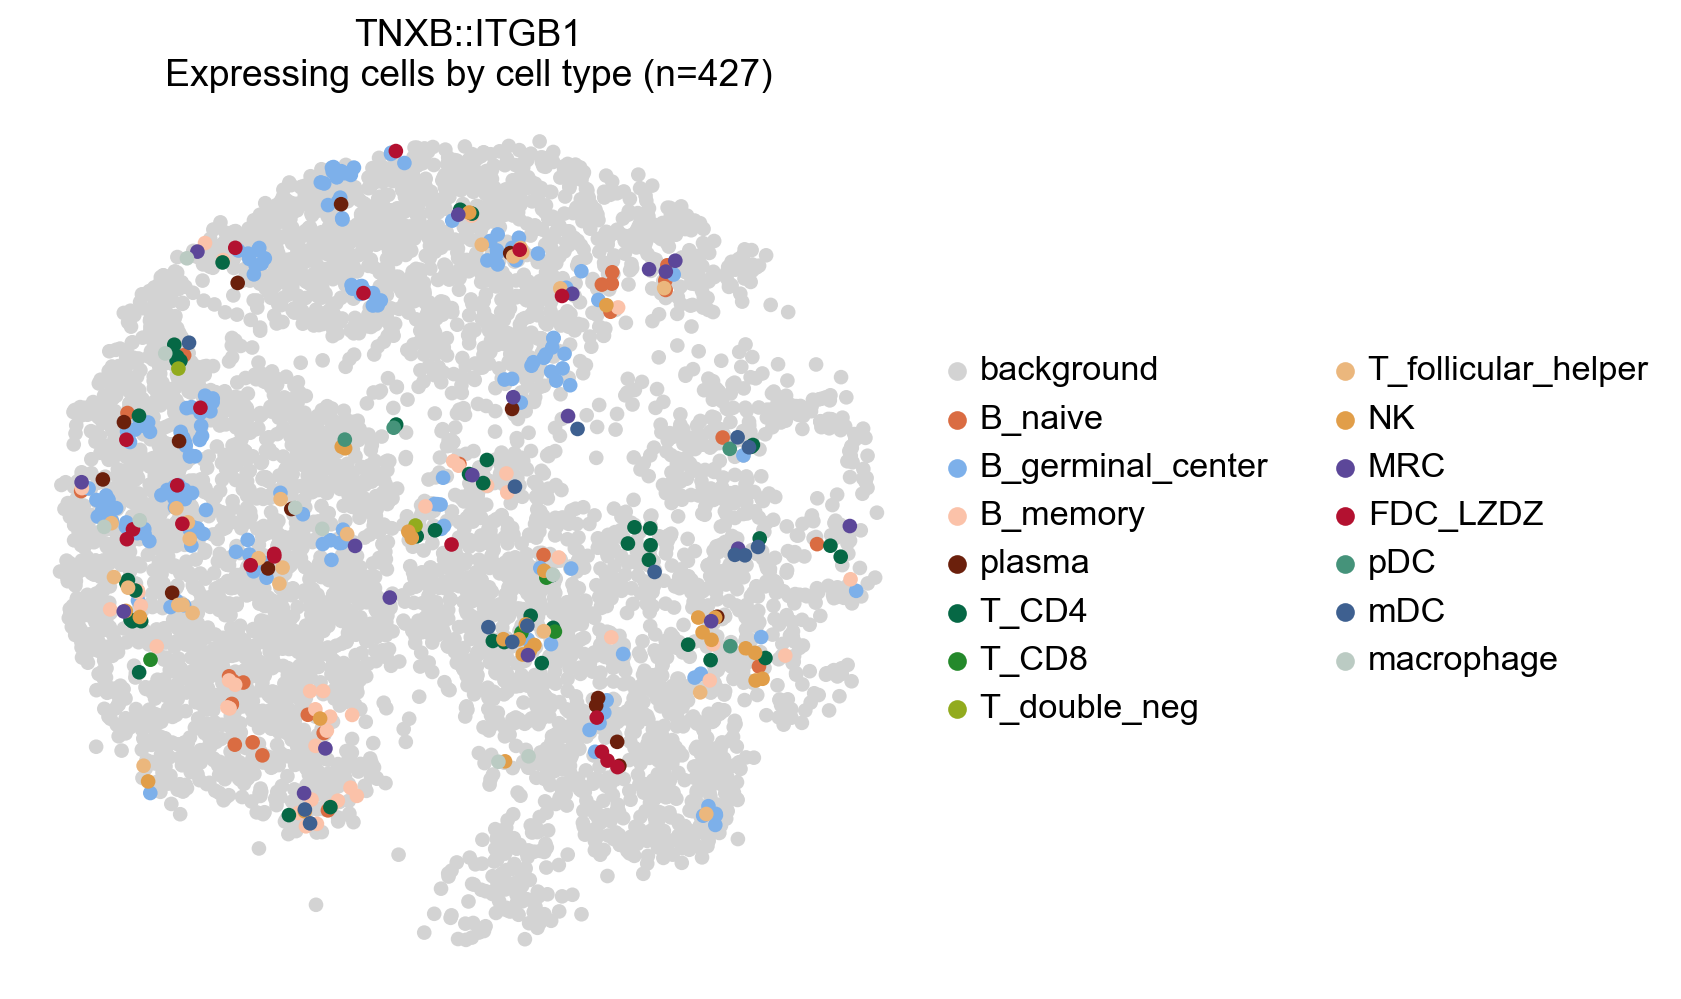
[62]:
# Plot any cell that has an interaction score for a cetrain LR pair (participating in an interaction)
lr_adata.uns['cell_type_colors'] = adata.uns['cell_type_colors'].copy()
# Highlight all expressing cells with original colors by setting `highlight_all_expressing=True`
la.pl.plotCCCSpatial(
    lr_adata,
    basis='X_spatial',
    interaction='TNXB::ITGB1',
    cell_type='cell_type',
    background_color='lightgrey',
    highlight_all_expressing=True,
    size=120,
    fig_width=6,
)
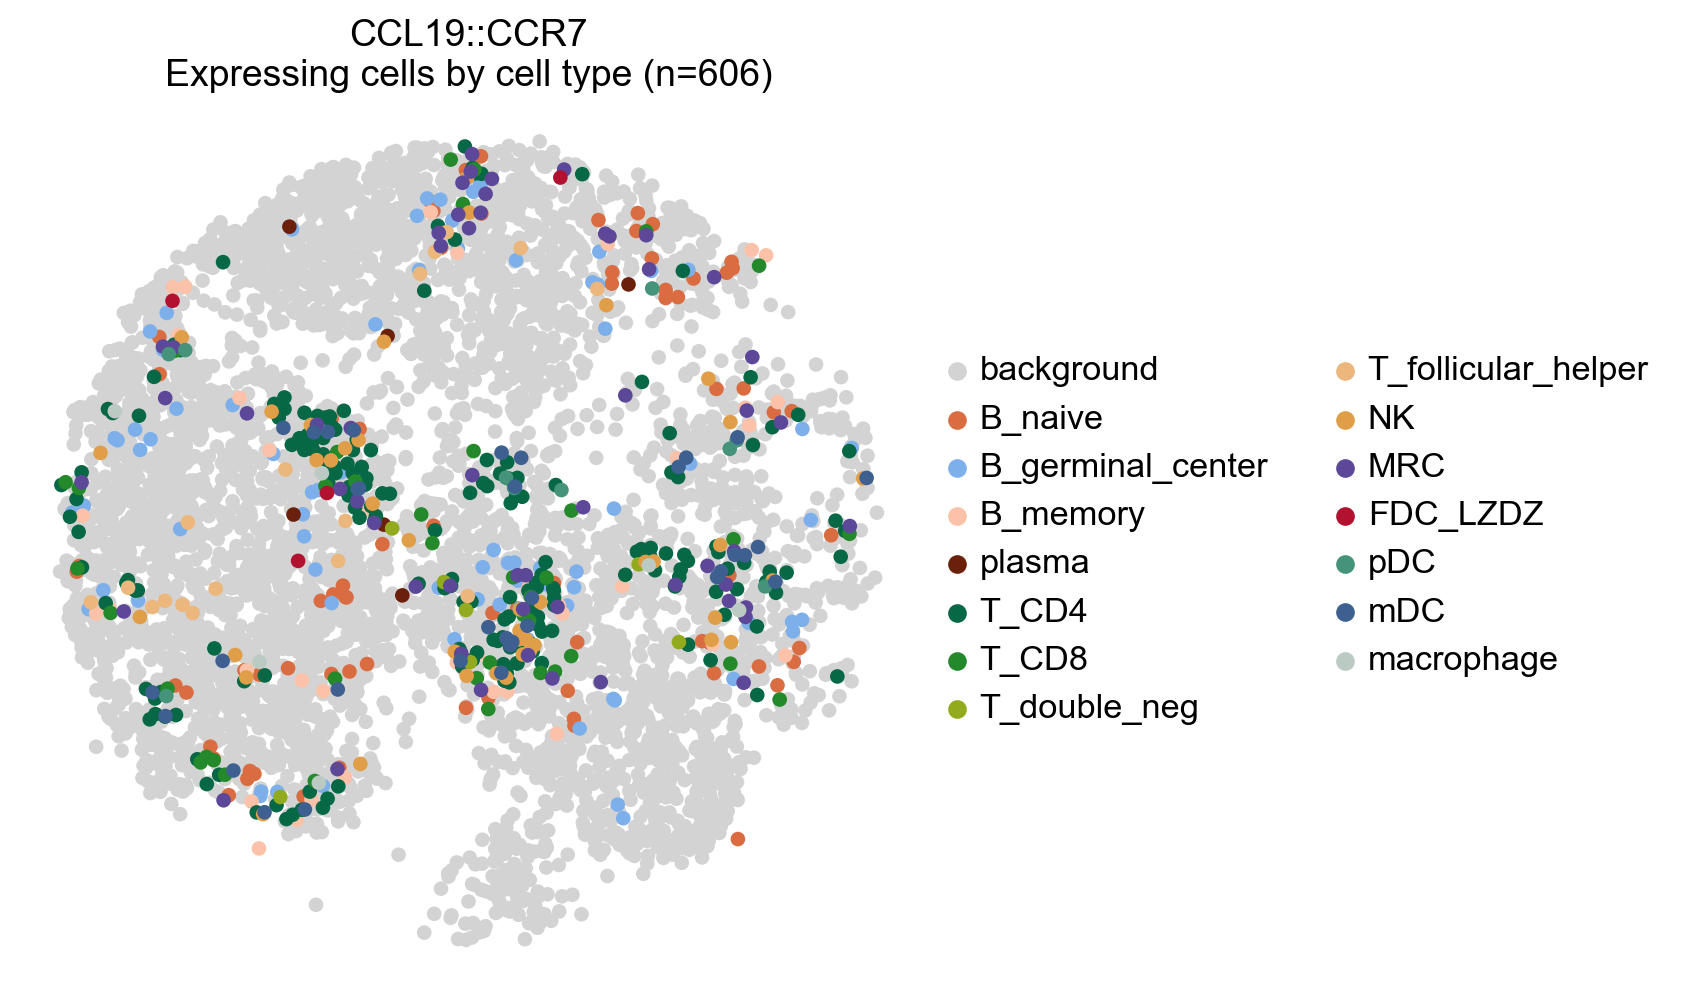
[63]:
# Plot any cell that has an interaction score for a cetrain LR pair (participating in an interaction)
lr_adata.uns['cell_type_colors'] = adata.uns['cell_type_colors'].copy()
# Highlight all expressing cells with original colors by setting `highlight_all_expressing=True`
la.pl.plotCCCSpatial(
    lr_adata,
    basis='X_spatial',
    interaction='CCL19::CCR7',
    cell_type='cell_type',
    background_color='lightgrey',
    highlight_all_expressing=True,
    size=120,
    fig_width=6,
)
Save the plot#
To save the plot, please use the save parameter in each plotting function within LARIS:
[64]:
la.pl.plotCCCHeatmap(
    res_LARIS,
    save='./LARIS_ccc_heatmap.pdf'
)
Figure saved to: ./LARIS_ccc_heatmap.pdf
