Running GDR on mouse pancreatic endocrinogenesis data#
[1]:
import numpy as np
import pandas as pd
import scanpy as sc
sc.set_figure_params(dpi=80,dpi_save=300, color_map='viridis',facecolor='white')
from matplotlib import rcParams
# To modify the default figure size, use rcParams.
rcParams['figure.figsize'] = 4, 4
rcParams['font.sans-serif'] = "Arial"
rcParams['font.family'] = "Arial"
sc.settings.verbosity = 3
sc.logging.print_header()
/tmp/ipykernel_3801756/1353975569.py:11: RuntimeWarning: Failed to import dependencies for application/vnd.jupyter.widget-view+json representation. (ModuleNotFoundError: No module named 'ipywidgets')
  sc.logging.print_header()
[1]:
| Component | Info |
|---|---|
| Python | 3.10.19 (main, Oct 21 2025, 16:43:05) [GCC 11.2.0] |
| OS | Linux-5.14.0-611.13.1.el9_7.x86_64-x86_64-with-glibc2.34 |
| CPU | 96 logical CPU cores, x86_64 |
| GPU | No GPU found |
| Updated | 2025-12-19 21:24 |
Dependencies
| Dependency | Version |
|---|---|
| six | 1.17.0 |
| jedi | 0.19.2 |
| kiwisolver | 1.4.9 |
| prompt_toolkit | 3.0.52 |
| wcwidth | 0.2.13 |
| texttable | 1.7.0 |
| llvmlite | 0.46.0 |
| joblib | 1.5.3 |
| igraph | 0.11.9 |
| tqdm | 4.67.1 |
| decorator | 5.2.1 |
| cycler | 0.12.1 |
| setuptools | 80.9.0 |
| h5py | 3.15.1 |
| ipython | 8.30.0 |
| leidenalg | 0.10.2 |
| asttokens | 3.0.0 |
| parso | 0.8.5 |
| torch | 2.9.1 (2.9.1+cu128) |
| tornado | 6.5.4 |
| psutil | 7.0.0 |
| pytz | 2025.2 |
| python-dateutil | 2.9.0.post0 |
| numba | 0.63.1 |
| stack_data | 0.6.3 |
| pure_eval | 0.2.3 |
| debugpy | 1.8.16 |
| natsort | 8.4.0 |
| pillow | 12.0.0 |
| executing | 2.2.1 |
Copyable Markdown
| Dependency      | Version             |
| --------------- | ------------------- |
| six             | 1.17.0              |
| jedi            | 0.19.2              |
| kiwisolver      | 1.4.9               |
| prompt_toolkit  | 3.0.52              |
| wcwidth         | 0.2.13              |
| texttable       | 1.7.0               |
| llvmlite        | 0.46.0              |
| joblib          | 1.5.3               |
| igraph          | 0.11.9              |
| tqdm            | 4.67.1              |
| decorator       | 5.2.1               |
| cycler          | 0.12.1              |
| setuptools      | 80.9.0              |
| h5py            | 3.15.1              |
| ipython         | 8.30.0              |
| leidenalg       | 0.10.2              |
| asttokens       | 3.0.0               |
| parso           | 0.8.5               |
| torch           | 2.9.1 (2.9.1+cu128) |
| tornado         | 6.5.4               |
| psutil          | 7.0.0               |
| pytz            | 2025.2              |
| python-dateutil | 2.9.0.post0         |
| numba           | 0.63.1              |
| stack_data      | 0.6.3               |
| pure_eval       | 0.2.3               |
| debugpy         | 1.8.16              |
| natsort         | 8.4.0               |
| pillow          | 12.0.0              |
| executing       | 2.2.1               |

| Component | Info                                                     |
| --------- | -------------------------------------------------------- |
| Python    | 3.10.19 (main, Oct 21 2025, 16:43:05) [GCC 11.2.0]       |
| OS        | Linux-5.14.0-611.13.1.el9_7.x86_64-x86_64-with-glibc2.34 |
| CPU       | 96 logical CPU cores, x86_64                             |
| GPU       | No GPU found                                             |
| Updated   | 2025-12-19 21:24                                         |
Setting paths#
[2]:
save_dir='/n/data1/hms/neurobio/fishell/mindai/Result/single-cell/Methods/PIASO/GDR'
sc.settings.figdir = save_dir
prefix='GDR_test_mousePancreaticEndocrinogenesis'
import os
if not os.path.exists(save_dir):
    os.makedirs(save_dir)
Import PIASO#
[3]:
import piaso
/n/data1/hms/neurobio/fishell/mindai/.conda/envs/nca/lib/python3.10/site-packages/tqdm/auto.py:21: TqdmWarning: IProgress not found. Please update jupyter and ipywidgets. See https://ipywidgets.readthedocs.io/en/stable/user_install.html
  from .autonotebook import tqdm as notebook_tqdm
Load data#
The orginal publication for this dataset: > Aimée Bastidas-Ponce, Sophie Tritschler, Leander Dony, Katharina Scheibner, Marta Tarquis-Medina, Ciro Salinno, Silvia Schirge, Ingo Burtscher, Anika Böttcher, Fabian J. Theis, Heiko Lickert, Mostafa Bakhti, Allon Klein, Barbara Treutlein; Comprehensive single cell mRNA profiling reveals a detailed roadmap for pancreatic endocrinogenesis. Development 15 June 2019; 146 (12): dev173849. doi: https://doi.org/10.1242/dev.173849
Brief descriptions about this dataset, which is widely used as an example dataset for RNA velocity analysis: >Pancreatic epithelial and Ngn3-Venus fusion (NVF) cells during secondary transition with transcriptome profiles sampled from embryonic day 15.5.
Endocrine cells are derived from endocrine progenitors located in the pancreatic epithelium. Endocrine commitment terminates in four major fates: glucagon- producing α-cells, insulin-producing β-cells, somatostatin-producing δ-cells and ghrelin-producing ε-cells.
[4]:
data_name = 'Pancreas_with_cc'
os.system('cd ' + save_dir + ' && wget -q https://cell2fate.cog.sanger.ac.uk/' + data_name + '/' + data_name + '_anndata.h5ad')
[4]:
0
[5]:
adata=sc.read(save_dir+'/Pancreas_with_cc_anndata.h5ad')
/n/data1/hms/neurobio/fishell/mindai/.conda/envs/nca/lib/python3.10/site-packages/anndata/compat/__init__.py:371: FutureWarning: Moving element from .uns['neighbors']['distances'] to .obsp['distances'].

This is where adjacency matrices should go now.
  warn(
/n/data1/hms/neurobio/fishell/mindai/.conda/envs/nca/lib/python3.10/site-packages/anndata/compat/__init__.py:371: FutureWarning: Moving element from .uns['neighbors']['connectivities'] to .obsp['connectivities'].

This is where adjacency matrices should go now.
  warn(
[6]:
adata.X.data
[6]:
array([ 2., 2., 14., ..., 2., 8., 2.], shape=(9298890,), dtype=float32)
[7]:
adata.layers['raw']=adata.layers['spliced']+adata.layers['unspliced'].copy()
Normalization#
[8]:
sc.pp.normalize_total(adata, target_sum=1e4)
sc.pp.log1p(adata)
adata.layers['log1p']=adata.X.copy()
normalizing counts per cell
    finished (0:00:00)
[9]:
adata
[9]:
AnnData object with n_obs × n_vars = 3696 × 27998
    obs: 'clusters_coarse', 'clusters', 'S_score', 'G2M_score'
    var: 'highly_variable_genes'
    uns: 'clusters_coarse_colors', 'clusters_colors', 'day_colors', 'neighbors', 'pca', 'log1p'
    obsm: 'X_pca', 'X_umap'
    layers: 'spliced', 'unspliced', 'raw', 'log1p'
    obsp: 'distances', 'connectivities'
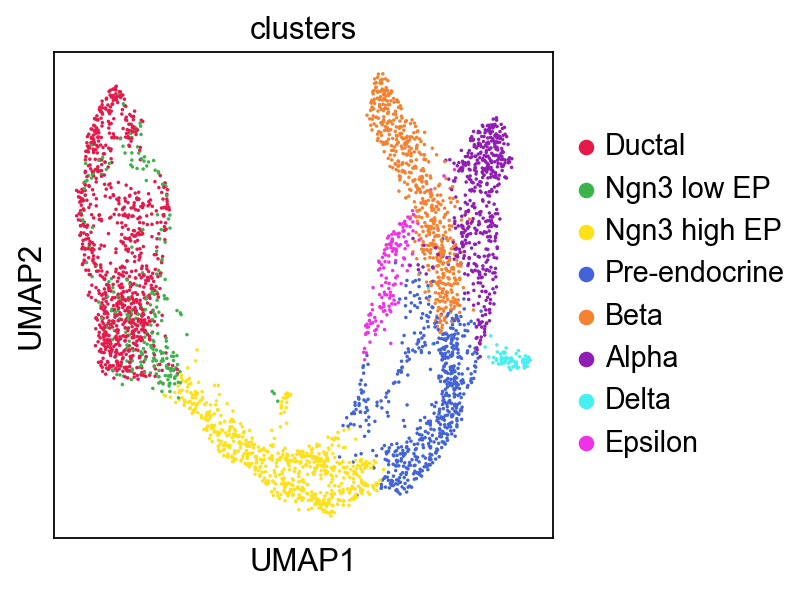
[10]:
sc.pl.umap(adata,
           color=['clusters'],
           palette=piaso.pl.color.d_color4,
           cmap=piaso.pl.color.c_color1,
           ncols=3,
           size=10,
           frameon=True)
[11]:
adata.obs['CellTypes']=adata.obs['clusters'].copy()
[12]:
adata.obsm['X_umap_author']=adata.obsm['X_umap'].copy()
Run GDR#
The 2D visualization of cells is important for the RNA velocity analysis and cell type diversification analayis in developmental datasets.
[13]:
%%time
piaso.tl.infog(adata,
               layer='raw',
               n_top_genes=3000,)
The normalized data is saved as `infog` in `adata.layers`.
The highly variable genes are saved as `highly_variable` in `adata.var`.
Finished INFOG normalization.
CPU times: user 587 ms, sys: 184 ms, total: 771 ms
Wall time: 773 ms
[14]:
%%time
piaso.tl.runGDRParallel(adata,
                        # batch_key='Sample',
                        groupby=None,
                        n_gene=20,
                        mu=10,
                        resolution=2.0,
                        layer='infog',
                        infog_layer='raw',
                        score_layer='infog',
                        scoring_method='piaso',
                        use_highly_variable=True,
                        n_highly_variable_genes=3000,
                        n_svd_dims=30,
                        key_added='X_gdr',
                        max_workers=32,
                        calculate_score_multiBatch=False,
                        verbosity=0)
The cell embeddings calculated by GDR were saved as `X_gdr` in adata.obsm.
CPU times: user 9.92 s, sys: 433 ms, total: 10.4 s
Wall time: 36.7 s
[15]:
%%time
sc.pp.neighbors(adata,
                use_rep='X_gdr',
               n_neighbors=15,random_state=10,knn=True,
                method="umap")

sc.tl.umap(adata)
computing neighbors
    finished: added to `.uns['neighbors']`
    `.obsp['distances']`, distances for each pair of neighbors
    `.obsp['connectivities']`, weighted adjacency matrix (0:00:00)
computing UMAP
    finished: added
    'X_umap', UMAP coordinates (adata.obsm)
    'umap', UMAP parameters (adata.uns) (0:00:04)
CPU times: user 6.47 s, sys: 7.21 ms, total: 6.48 s
Wall time: 4.74 s
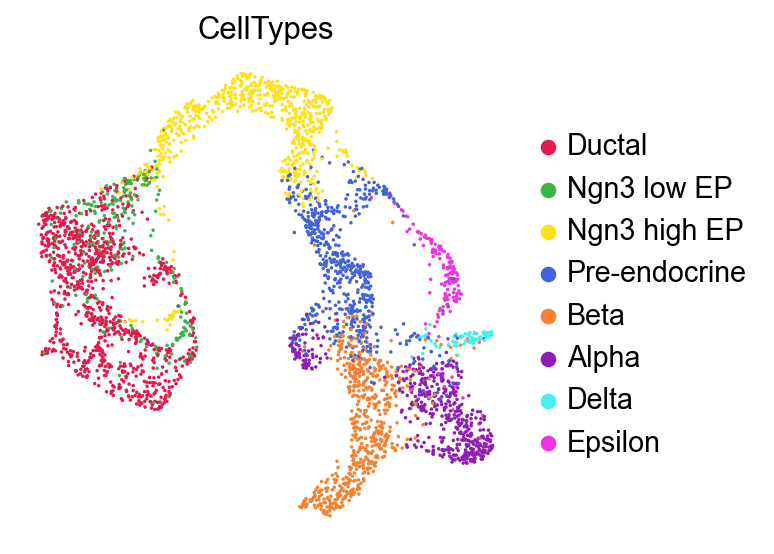
[16]:
sc.pl.embedding(
    adata,
    basis='X_umap',
    color=['CellTypes'],
    palette=piaso.pl.color.d_color4,
    cmap=piaso.pl.color.c_color1,
    ncols=3,
    size=10,
    frameon=True
)
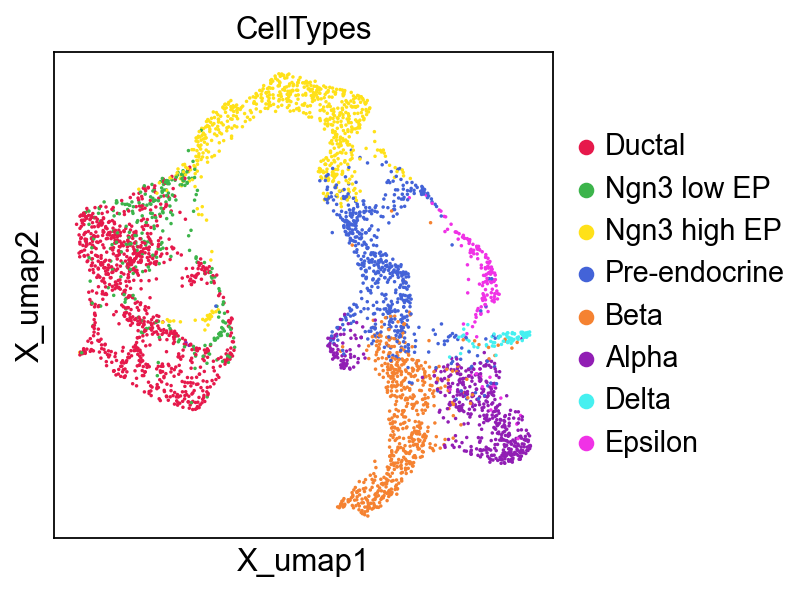
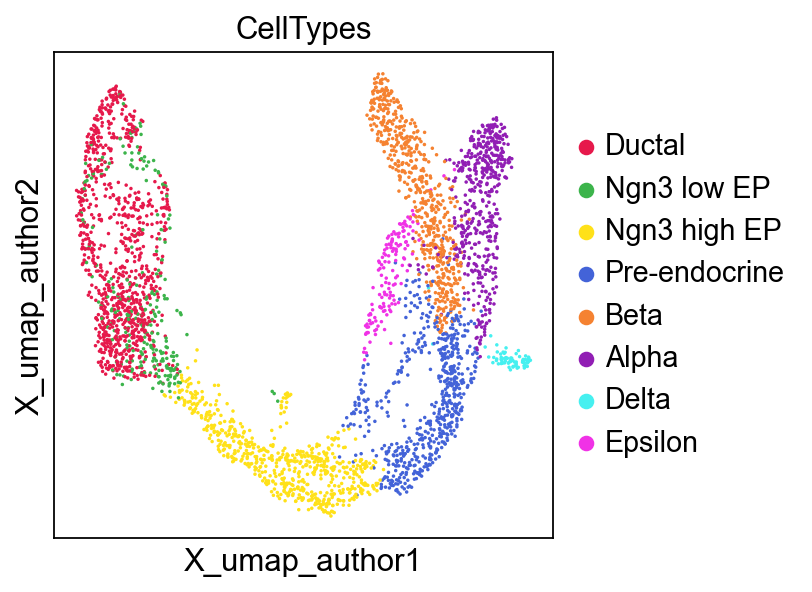
The UMAP plots based on GDR is slightly different from the original UMAP:
[17]:
sc.pl.embedding(
    adata,
    basis='X_umap_author',
    color=['CellTypes'],
    palette=piaso.pl.color.d_color4,
    cmap=piaso.pl.color.c_color1,
    ncols=3,
    size=10,
    frameon=True
)
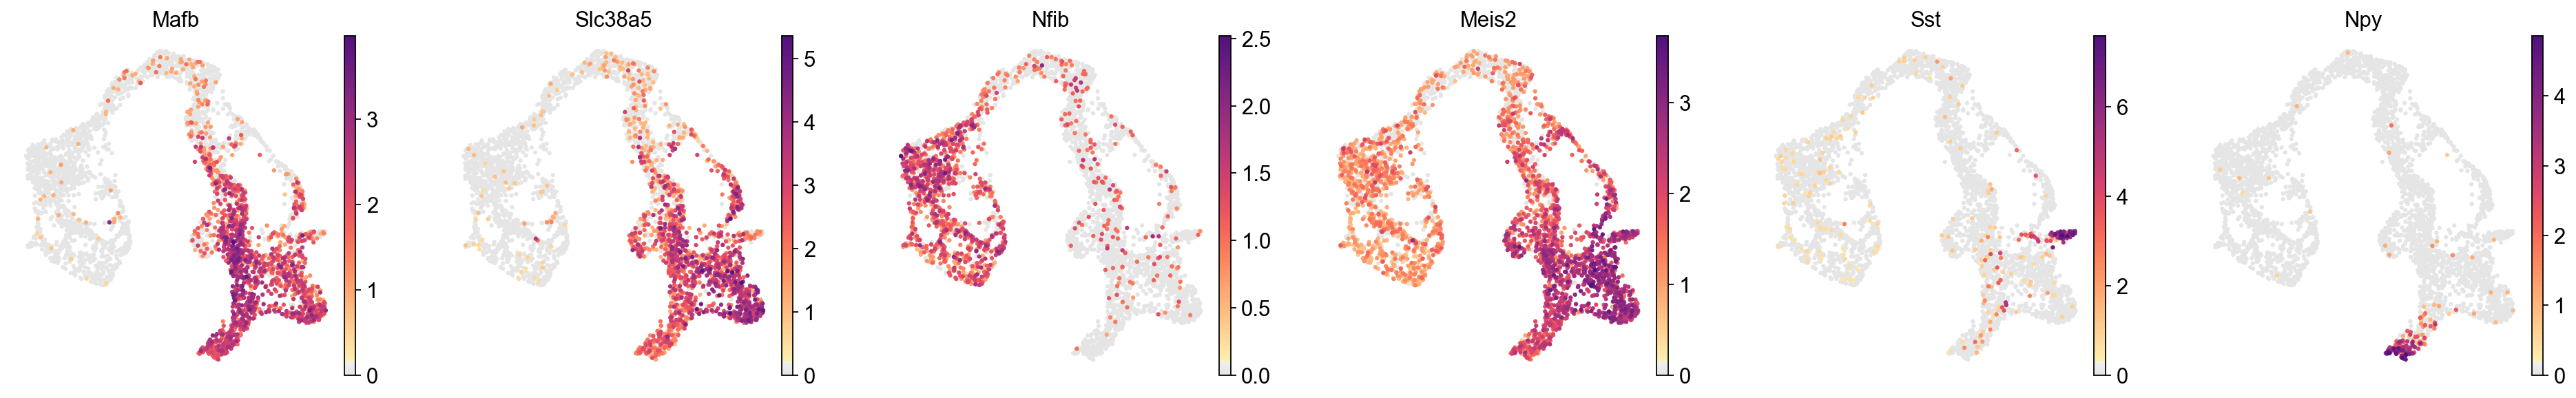
[18]:
sc.pl.embedding(
    adata,
    basis='X_umap',
    color=['Mafb', 'Slc38a5', 'Nfib', 'Meis2', 'Sst', 'Npy'],
    layer='log1p',
    palette=piaso.pl.color.d_color4,
    cmap=piaso.pl.color.c_color1,
    ncols=6,
    # size=60,
    frameon=False
)
[19]:
sc.pl.embedding(
    adata,
    basis='X_umap',
    color=['CellTypes'],
    palette=piaso.pl.color.d_color4,
    cmap=piaso.pl.color.c_color1,
    ncols=1,
    size=10,
    frameon=False
)
Run Clustering#
[20]:
%%time
sc.tl.leiden(adata,resolution=2,key_added='Leiden')
running Leiden clustering
    finished: found 24 clusters and added
    'Leiden', the cluster labels (adata.obs, categorical) (0:00:00)
CPU times: user 165 ms, sys: 2.06 ms, total: 167 ms
Wall time: 166 ms
<timed eval>:1: FutureWarning: In the future, the default backend for leiden will be igraph instead of leidenalg.

 To achieve the future defaults please pass: flavor="igraph" and n_iterations=2.  directed must also be False to work with igraph's implementation.
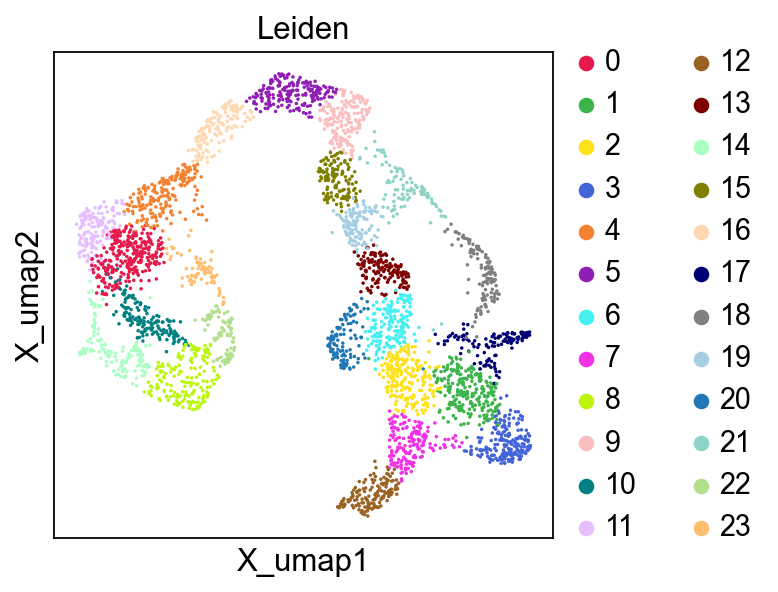
[21]:
sc.pl.embedding(
    adata,
    basis='X_umap',
    color=['Leiden'],
    palette=piaso.pl.color.d_color4,
    cmap=piaso.pl.color.c_color1,
    ncols=3,
    size=10,
    frameon=True
)
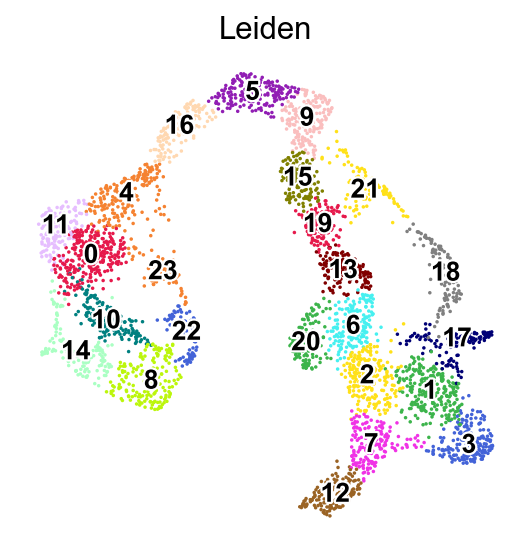
[22]:
sc.pl.umap(adata,
           color=['Leiden'],
           palette=piaso.pl.color.d_color1,
           cmap=piaso.pl.color.c_color1,
           legend_fontsize=12,
           legend_fontoutline=2,
           legend_loc='on data',
           ncols=1,
           size=10,
           frameon=False)
WARNING: Length of palette colors is smaller than the number of categories (palette length: 19, categories length: 24. Some categories will have the same color.
Run COSG#
[23]:
import cosg
[24]:
%%time
n_gene=30
cosg.cosg(adata,
          key_added='cosg',
          use_raw=False,
          layer='infog',
          mu=100,
          expressed_pct=0.1,
          remove_lowly_expressed=True,
          n_genes_user=100,
          groupby='Leiden')
CPU times: user 439 ms, sys: 51.9 ms, total: 491 ms
Wall time: 492 ms
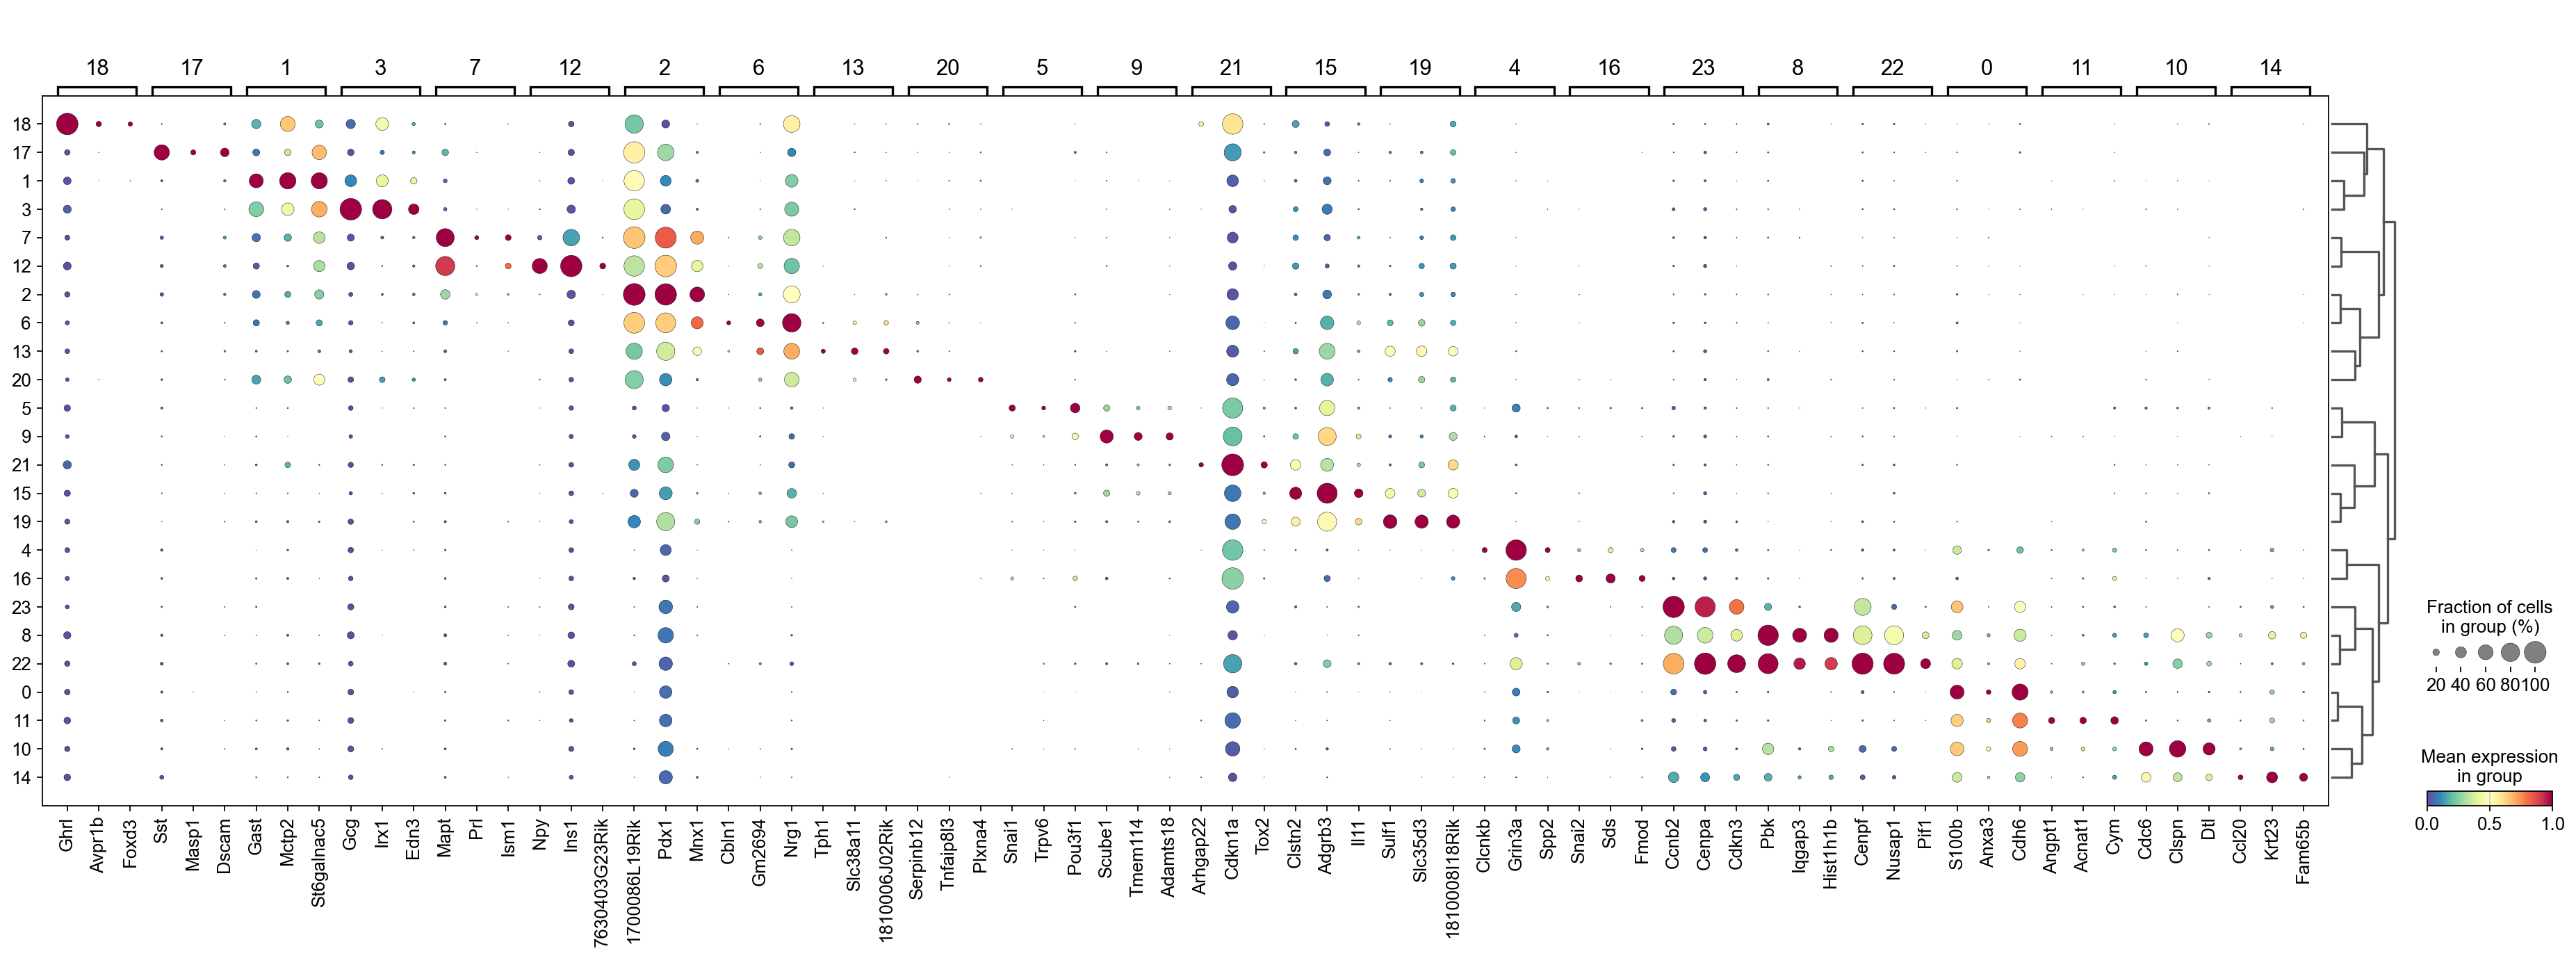
[25]:
sc.tl.dendrogram(adata,groupby='Leiden',use_rep='X_gdr')
df_tmp=pd.DataFrame(adata.uns['cosg']['names'][:3,]).T
df_tmp=df_tmp.reindex(adata.uns['dendrogram_'+'Leiden']['categories_ordered'])
marker_genes_list={idx: list(row.values) for idx, row in df_tmp.iterrows()}
marker_genes_list = {k: v for k, v in marker_genes_list.items() if not any(isinstance(x, float) for x in v)}

sc.pl.dotplot(adata,
              marker_genes_list,
              groupby='Leiden',
              layer='infog',
              dendrogram=True,
              swap_axes=False,
              standard_scale='var',
              cmap='Spectral_r')
Storing dendrogram info using `.uns['dendrogram_Leiden']`
[26]:
marker_gene=pd.DataFrame(adata.uns['cosg']['names'])
[27]:
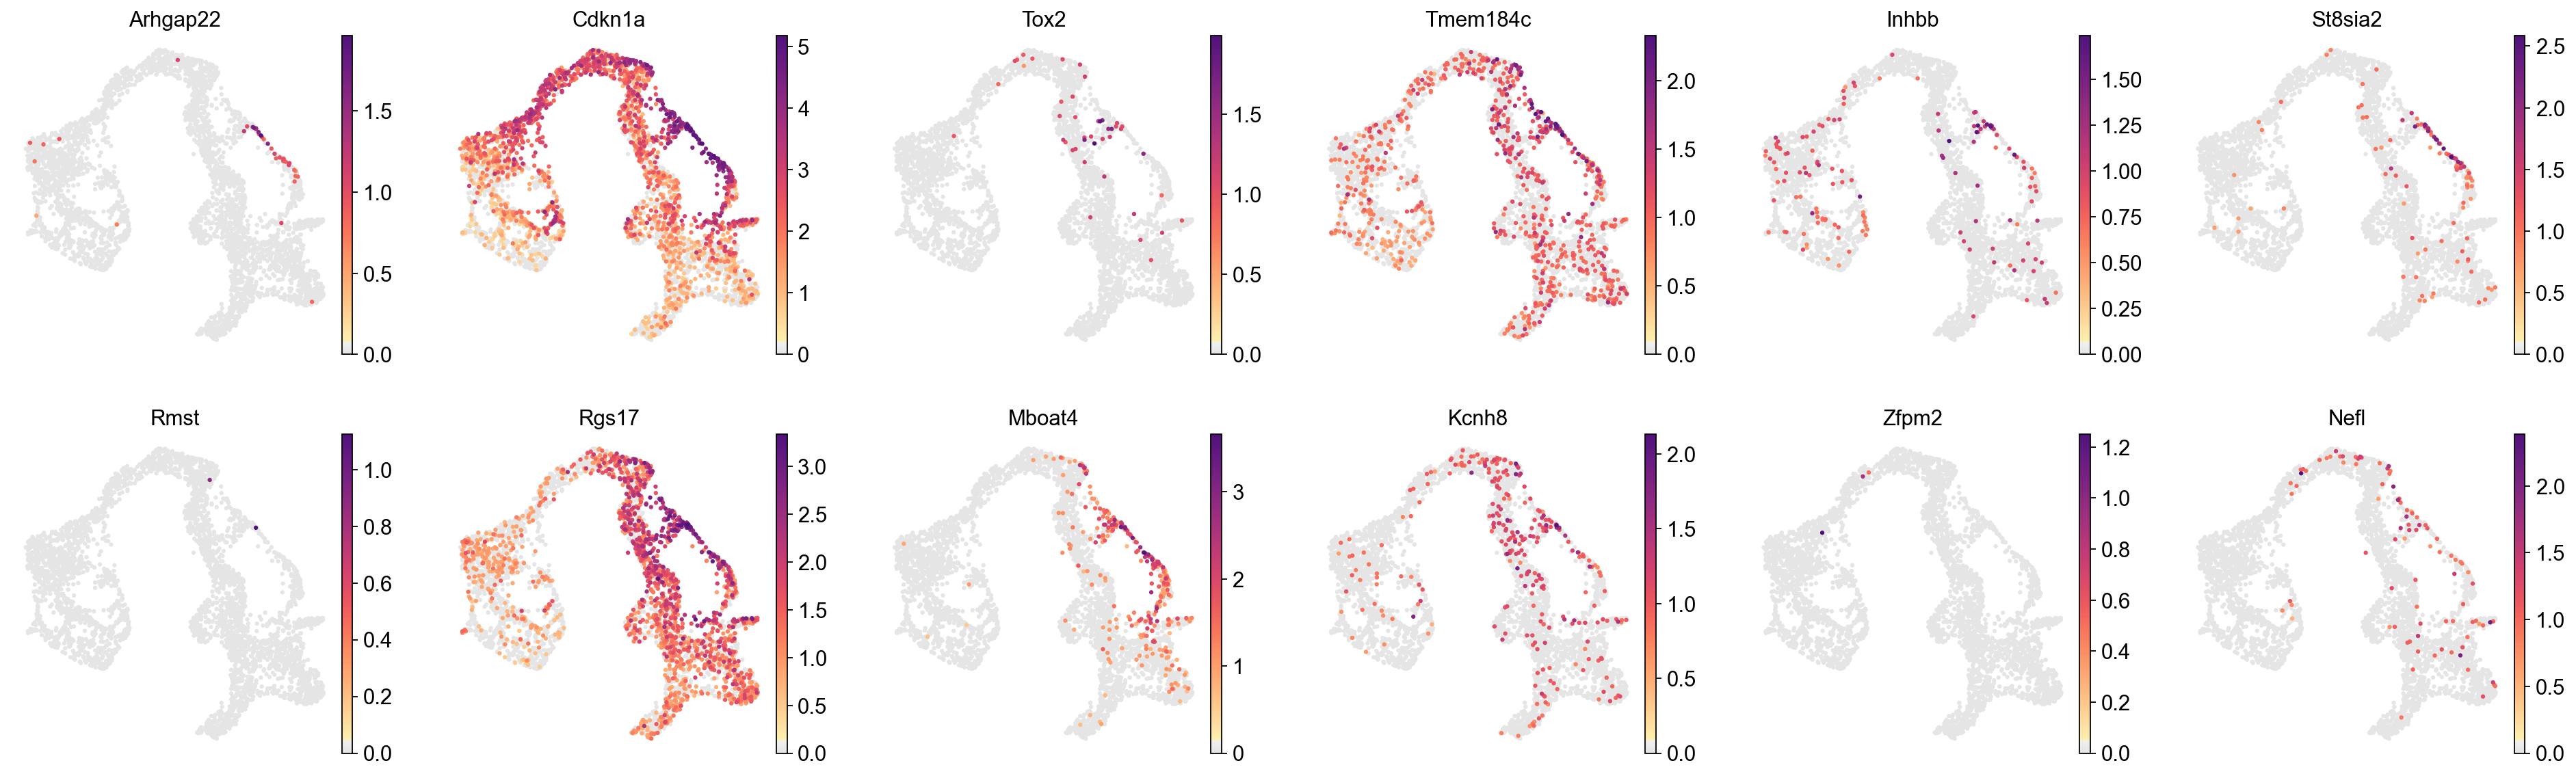
cluster_check='21'
marker_gene[cluster_check].values
[27]:
array(['Arhgap22', 'Cdkn1a', 'Tox2', 'Tmem184c', 'Inhbb', 'St8sia2',
       'Rmst', 'Rgs17', 'Mboat4', 'Kcnh8', 'Zfpm2', 'Nefl', 'Nefm',
       'Fam107b', 'Nab2', 'Stxbp5l', 'Tspan12', 'Ctnna3', 'Gm609',
       'Cacna2d1', 'Mreg', 'Lancl3', 'Trp53cor1', 'Bambi',
       '6430573F11Rik', 'Trp53i13', 'Cacna1c', 'Cer1', 'Klhdc8a',
       'Mfhas1', 'Isl1', 'Lrrtm3', 'Sms', 'Tiparp', 'Spock2', 'Abhd15',
       'Lpcat3', 'Scin', 'Jam3', 'Irs4', 'Kcnb2', 'Celf3',
       'B630019K06Rik', 'Pla2g2f', 'Abca1', 'Rph3al', 'Fgf9', 'Igsf8',
       'Cck', 'Krt7', 'Gprc5b', 'Slc8a1', 'Prox1os', 'Fhl2', 'Nkx2-2',
       'Hacd1', 'Tox', 'Tm4sf4', 'Fitm1', 'Camk2n2', 'Kcnq5', 'Mfap4',
       'Tmem170', 'Cecr2', 'Dedd2', 'Sfxn2', 'St18', 'Pygl', 'Mid1',
       'A330009N23Rik', 'Olfml2b', 'Cd200', 'Ptpn3', 'Peg3', 'Pclo',
       'Tes', 'Ephb2', 'Bcar3', 'Gm13919', 'Fam151a', 'Nt5c2', 'Runx1t1',
       'Tox3', 'Dll3', 'Foxa2', 'E330009J07Rik', 'Gm26954',
       '1810008I18Rik', 'BC023829', 'N4bp3', 'Selm', 'Pdk3', 'Cldn23',
       'Rbfox3', 'Abr', 'Sytl5', 'Jund', 'Fam210b', 'Ell2', 'Gng4'],
      dtype=object)
[28]:
sc.pl.embedding(
    adata,
    basis='X_umap',
    layer='log1p',
    color=marker_gene[cluster_check].values[:12],
    palette=piaso.pl.color.d_color4,
    cmap=piaso.pl.color.c_color1,
    ncols=6,
    # size=10,
    frameon=False
)
[29]:
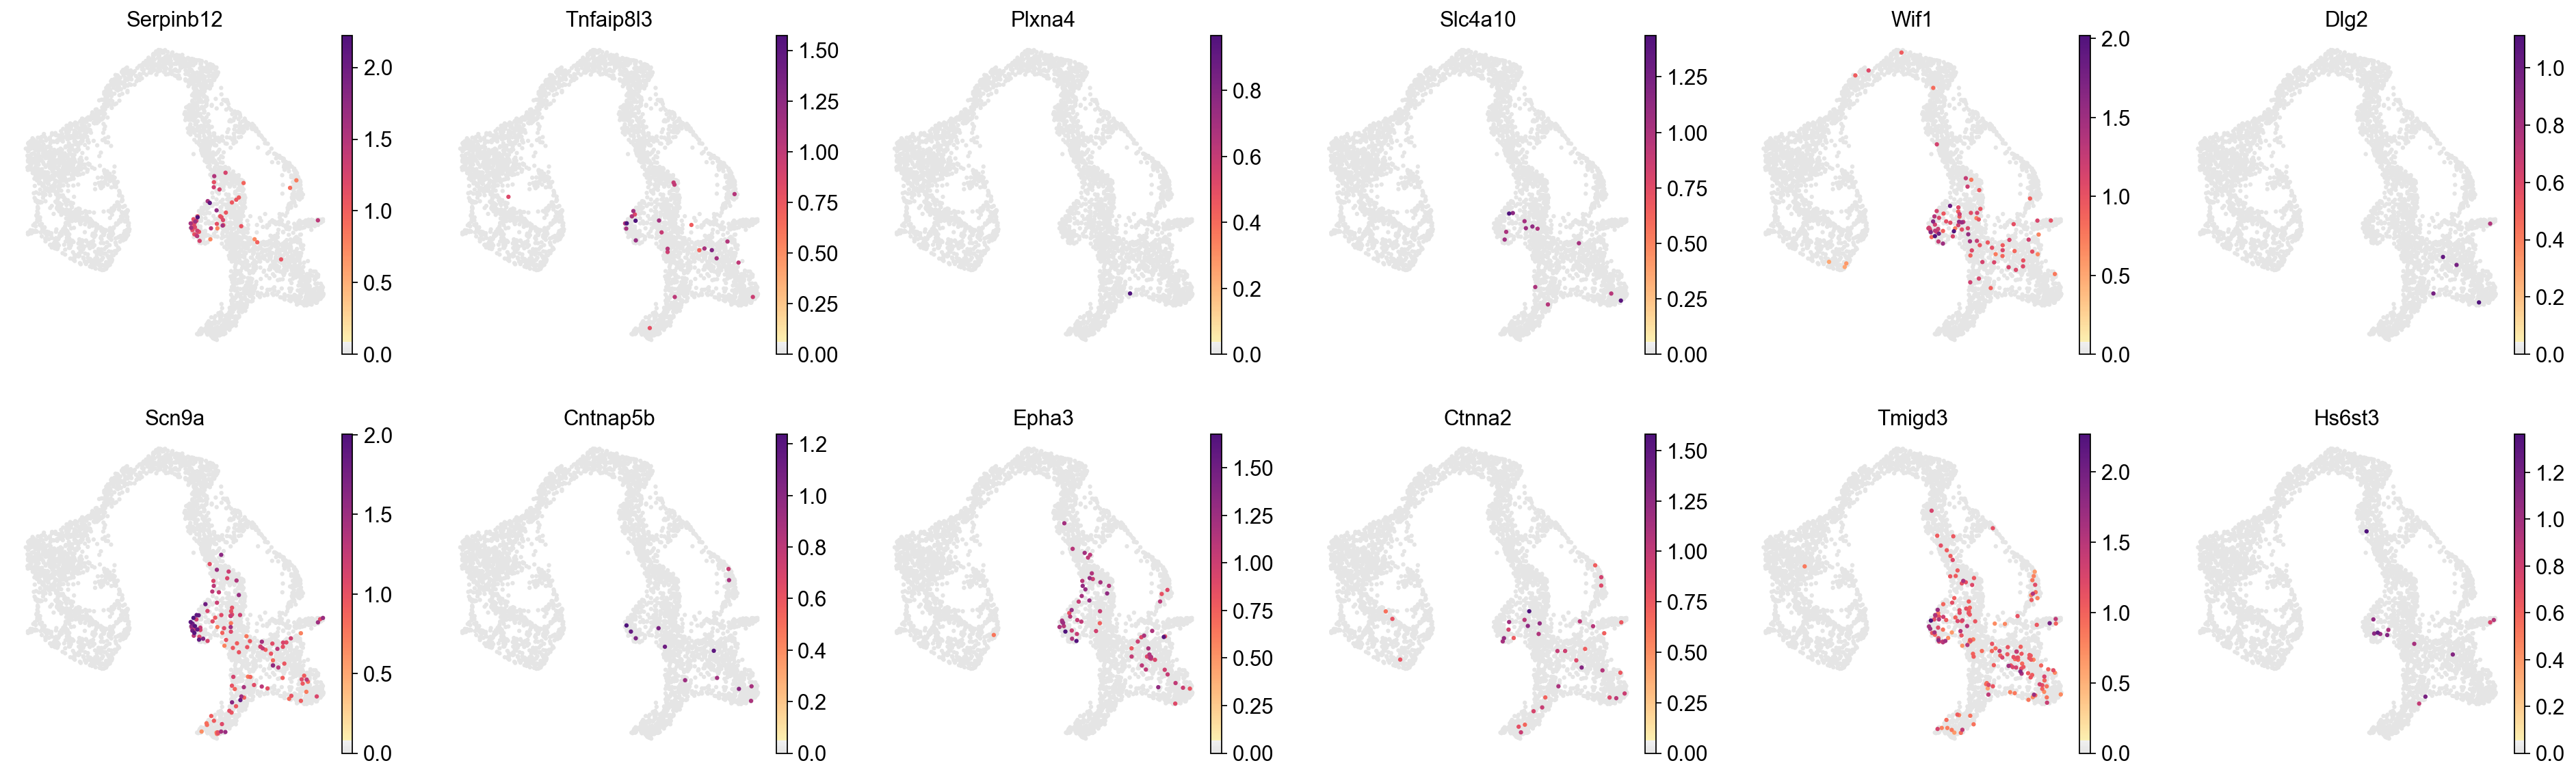
cluster_check='20'
marker_gene[cluster_check].values
[29]:
array(['Serpinb12', 'Tnfaip8l3', 'Plxna4', 'Slc4a10', 'Wif1', 'Dlg2',
       'Scn9a', 'Cntnap5b', 'Epha3', 'Ctnna2', 'Tmigd3', 'Hs6st3',
       'Pik3c2g', 'Inpp4b', 'Palld', 'Gm19590', 'Lrrc7', 'Sned1', 'Usp18',
       'Arx', 'Sez6l', 'Fam171b', 'Ptprm', 'Gm36975', 'Slc24a3', 'Prkg1',
       'BC048546', 'Gm2115', 'Entpd3', 'Fa2h', 'Cd55', 'Prss50', 'Aff2',
       'Ddc', 'Nell1', 'Sema3e', 'Serpinf2', 'Sdk1', 'A1cf', 'Suox',
       'Alcam', 'Gria3', 'C1galt1', 'Klb', 'Ocrl', 'Gpc4', 'AW551984',
       'Cyp4b1', 'Fxyd6', 'Rnf186', 'Gch1', 'Pcdh9', 'Zfp174', 'Mum1l1',
       'Rundc1', 'Kcnip4', 'Parm1', 'Ppp1r14c', 'Nup210', 'Oit1',
       'Smarca1', 'Cdh4', 'Serpinb1a', 'Gm43861', 'Pon2', 'Pam', 'Ikzf4',
       'Nr1h4', 'Cldn4', 'Fam213a', 'Ffar2', 'Drc1', 'Mapk15', 'Gm17484',
       'Gprasp2', 'Serpina10', 'Dnajc12', 'Fbxo32', 'Trim67', 'Gabrb3',
       'Ccdc184', 'Ankrd6', 'Mgst3', 'Ptbp3', 'A330017A19Rik', 'Gnai1',
       'Pax6', 'Hmgn3', 'AI467606', 'Gm12905', 'Sybu', 'Tmem163', 'Cd200',
       'Rundc3b', 'Glud1', 'Wnt4', 'Tmem117', 'Pdpr', 'Plag1', 'Anxa4'],
      dtype=object)
[30]:
sc.pl.embedding(
    adata,
    basis='X_umap',
    layer='log1p',
    color=marker_gene[cluster_check].values[:12],
    palette=piaso.pl.color.d_color4,
    cmap=piaso.pl.color.c_color1,
    ncols=6,
    # size=10,
    frameon=False
)
Save the data#
[31]:
adata.write(save_dir+'/'+prefix+'_gdr.h5ad')
[32]:
save_dir+'/'+prefix+'_gdr.h5ad'
[32]:
'/n/data1/hms/neurobio/fishell/mindai/Result/single-cell/Methods/PIASO/GDR/GDR_test_mousePancreaticEndocrinogenesis_gdr.h5ad'